Create a Table or Pivot Table
Create a Table
Adding tables into your dashboard is extremely helpful if you want to keep a close eye on your data. Additionally, grouping and filtering your data allows you to create the most insightful tables for your data. We will first go over how to create a basic table before we dive into more complex options.
Follow the next steps to create a table:
- Choose Table in the widget editor.
- Drag and drop a dimension to Group By. It will set a data view granularity and determine how your values are grouped.
- Drag and drop measures to Columns to set up columns of your table.
Create a Pivot Table
Pivot tables allow you to summarise or aggregate data by multiple variables represented as columns. With pivot tables, you can create more than one level of columns. For example, one level could be regions, and a sub-level - countries. To create a pivot table, follow the next steps:
- Drag and drop a dimension to Group By to set rows of a table.
- Drag and drop a dimension to Segment By to define a top-level of data aggregation as columns.
- Drag and drop a measure to Columns to define a sub-level of columns. This level is for metrics or values that you would like to apply an aggregate function to (e.g., SUM, MIN, MAX).
Widget-Level Settings
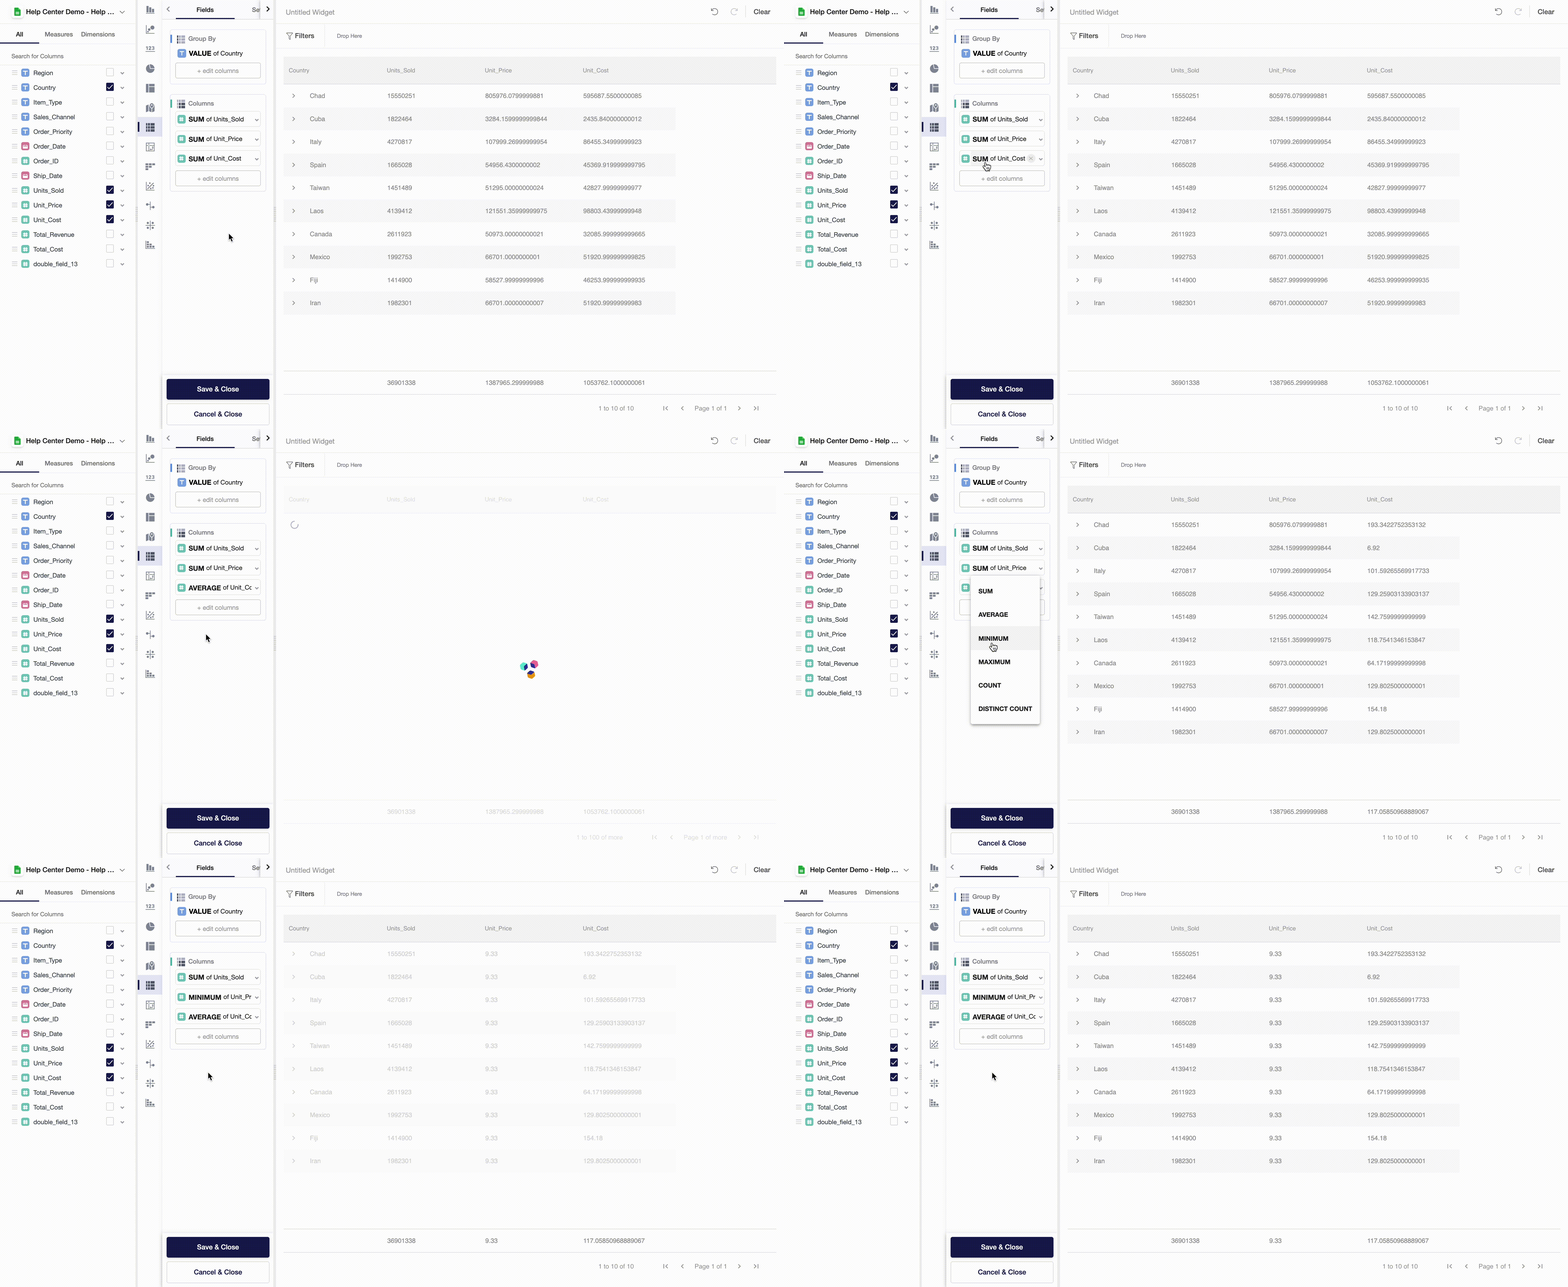
Currently, Y42 app supports multiple aggregate functions that you can apply to variables you use in your table. To change an aggregate function, simply click on bold text SUM and choose the most suitable function.

Filters
On a widget level, users can also set particular filters by dataset variables. To do so, you can drag and drop variables from the measures and dimensions field and then apply a filter to the variable you chose.
Updated over 3 years ago