How to work with Dashboards
Here we give a quick guide on how to set up your first Dashboard. For the full details on all Dashboard, Dashboard Tab and Canvas settings, see the Visualizations Reference Documentation.
Create a New Dashboard
A dashboard is a space populated by widgets - visual representations of your data. To create your first dashboard, follow these steps:
- Go to Visualizations -> Dashboards in the main left navigation bar
- Select Add...
- Name your dashboard. You can also give it a description.
- Select Commit to create the dashboard
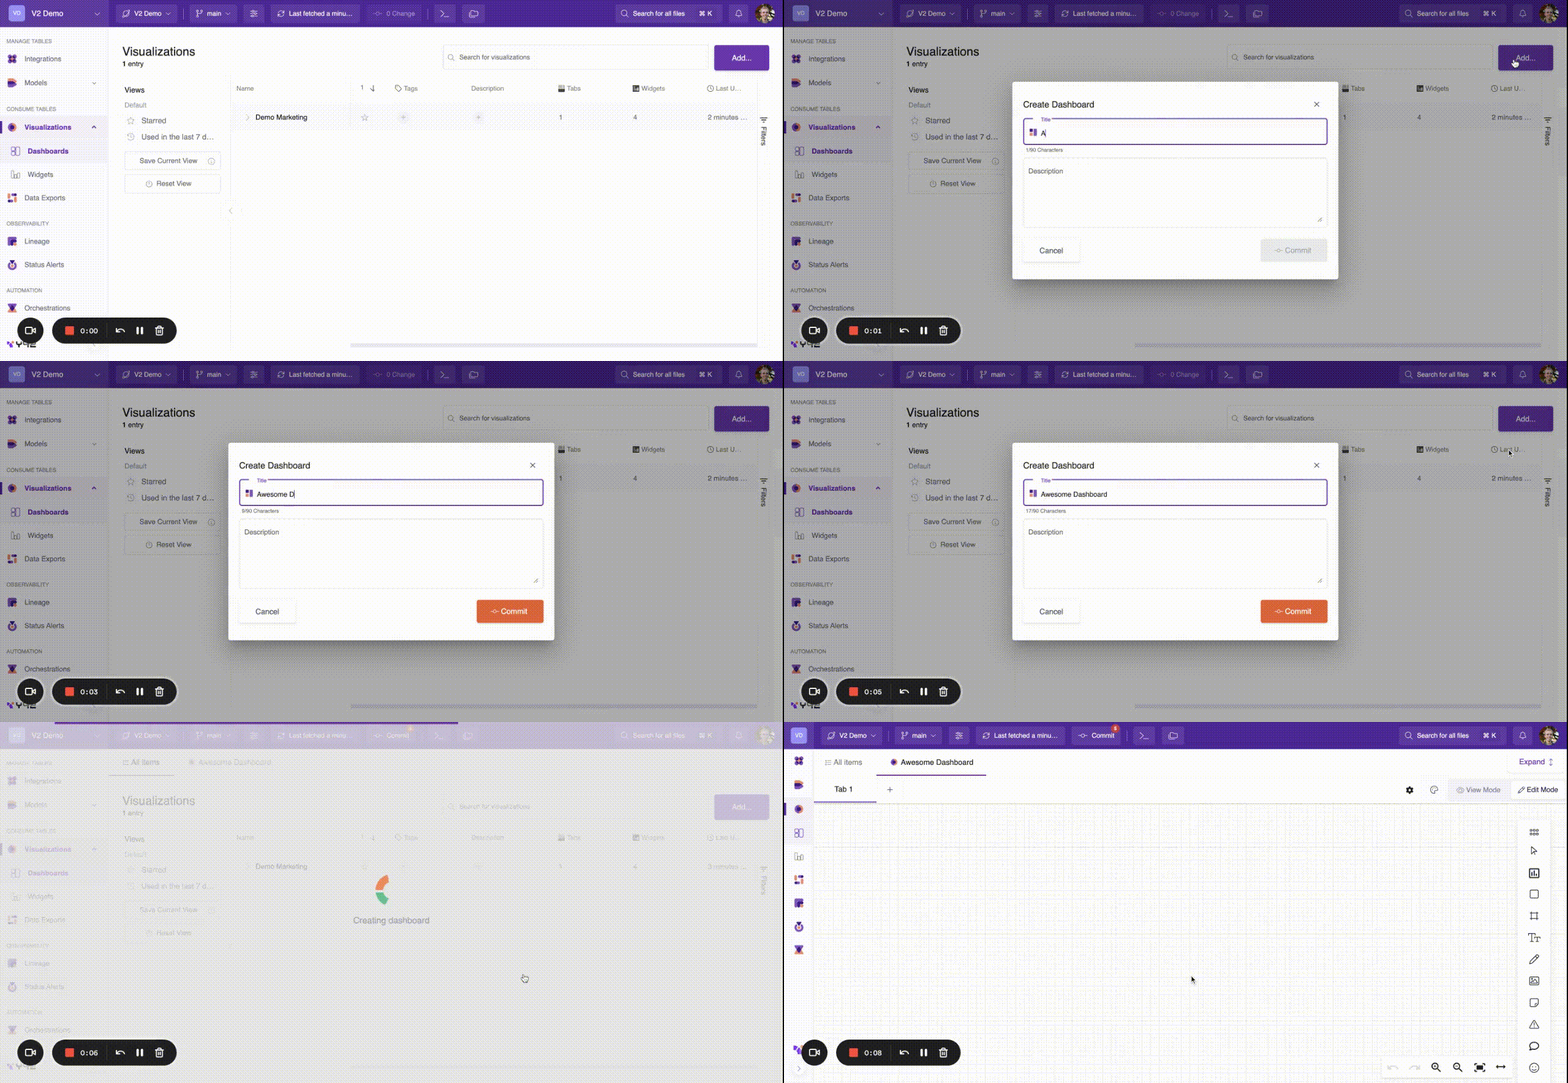
Congrats! You have now created a new dashboard, where you can customize and create widgets.
Create Tabs
Each tab is an empty canvas designed for you to organize your widgets and group them by different categories. You can easily add new tabs, change their order, and rename them.
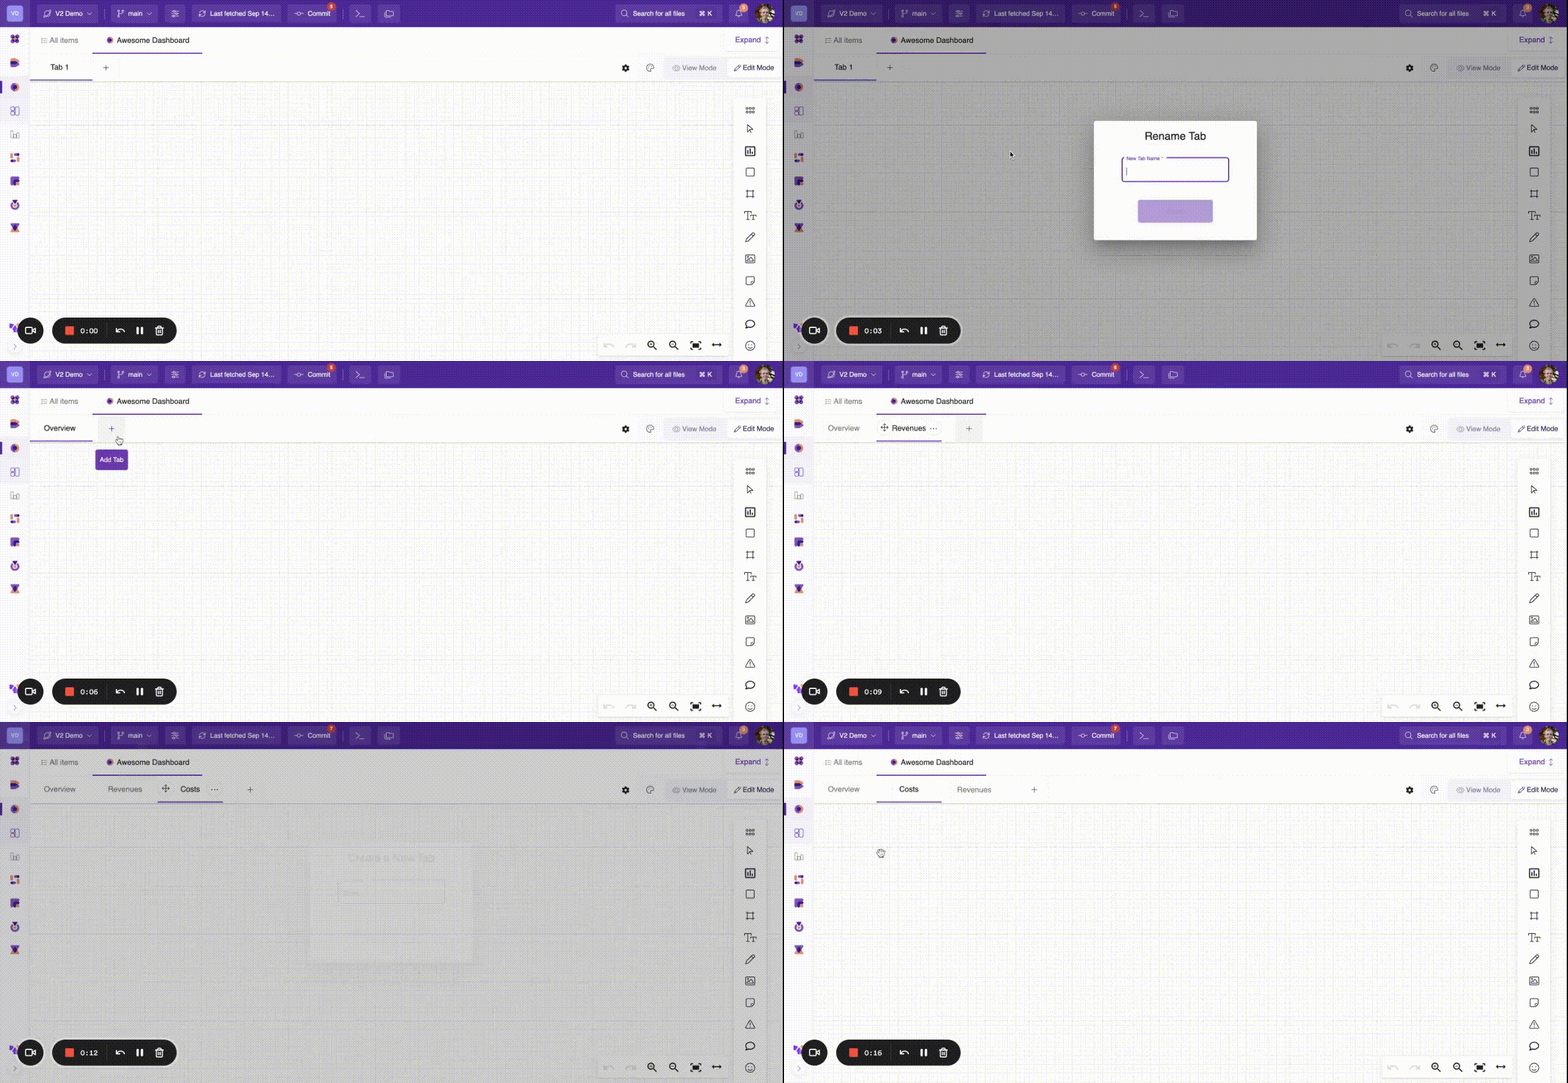
Build a Dashboard
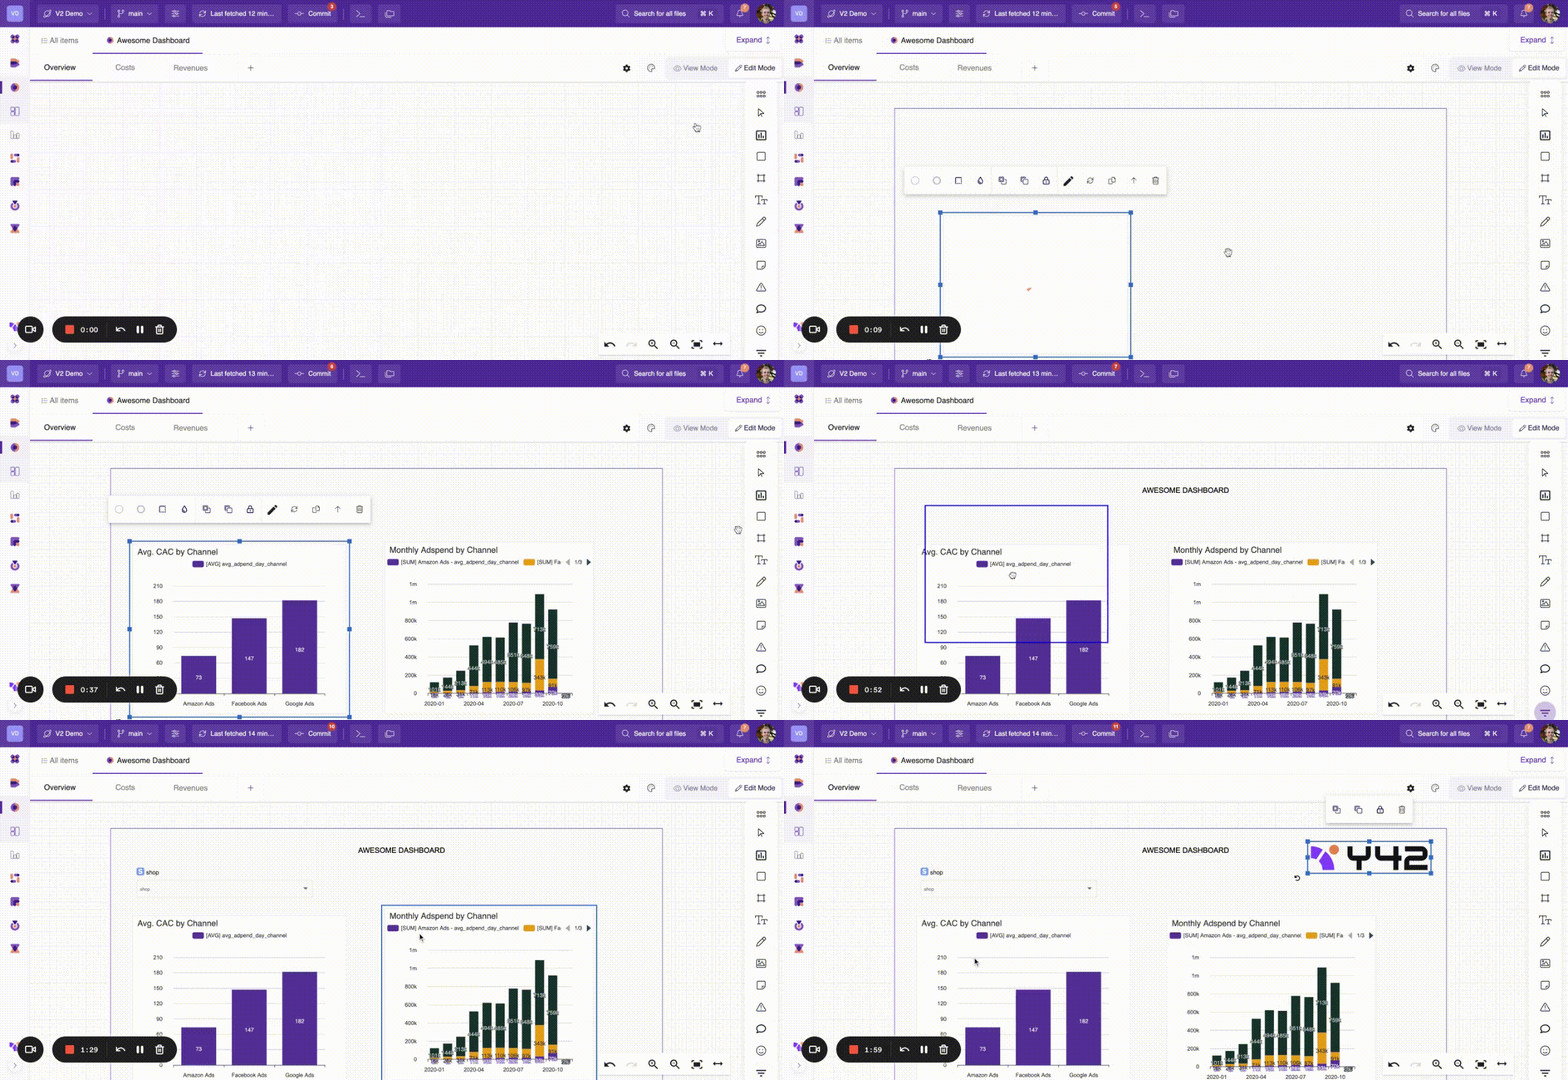
Dashboards can be opened in two modes: Edit Mode and View Mode. To start building a dashboard, simply:
- Select Edit mode
- Navigate to the canvas sidebar and add the following to the dashboard canvas
- A frame
- Several widgets for your Dashboard. Learn more on how to work with Widgets here.
- A title, and descriptions if necessary
- Dashboard filters
- Images, shapes and any other decoration or information you feel necessary
To learn more about individual Dashboard Settings, Tab Settings and Canvas Functionality see our Reference Documentation.
Edit Dashboard Theme
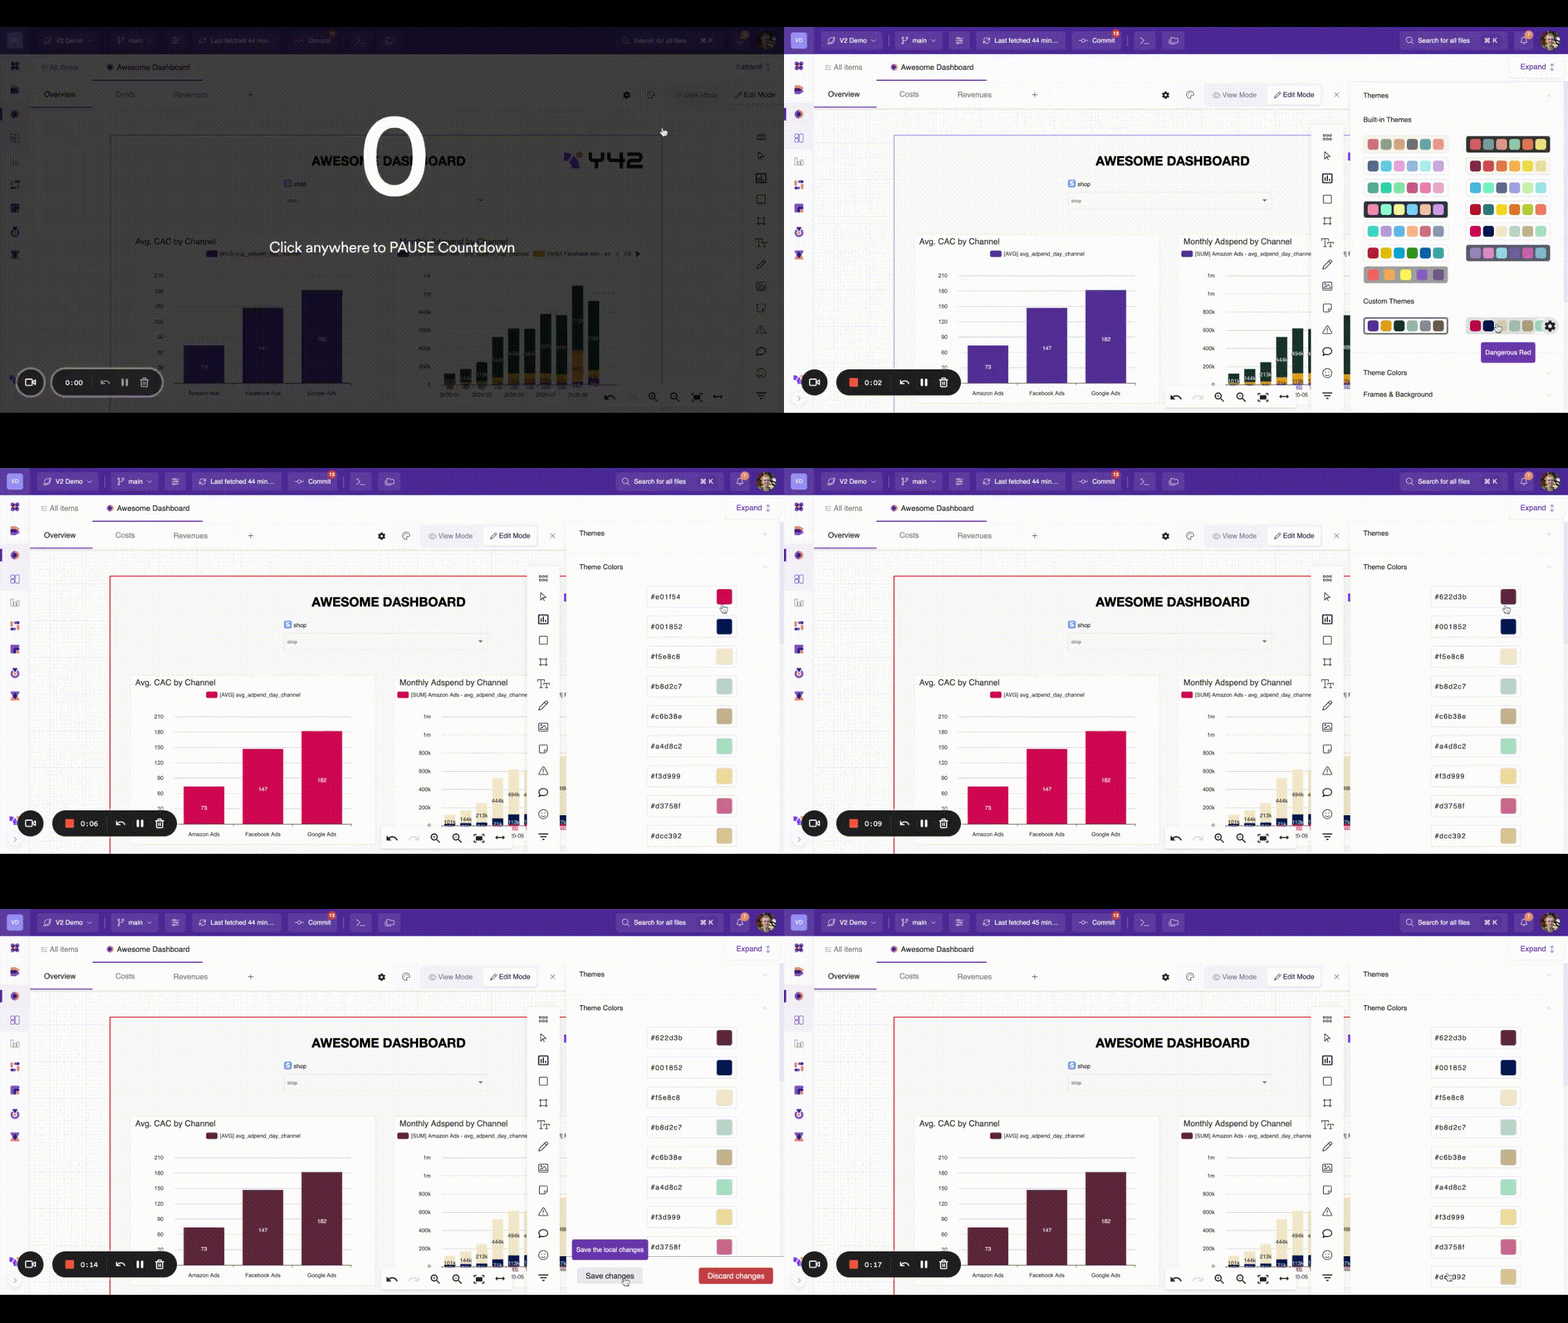
Y42 offers Customisable Styles that you can apply to all widgets across all tabs within a dashboard. This may simplify the way you design your report, and allow you to set a corporate identity for your dashboards, including dashboard level colors, axis settings, legend & tooltip settings and more.
See our Theme Settings Reference Documentation.
Important to note: all changes are applied on a global level - to all dashboard widgets. You can also adjust settings on a widget level separately.
Organize your Dashboards
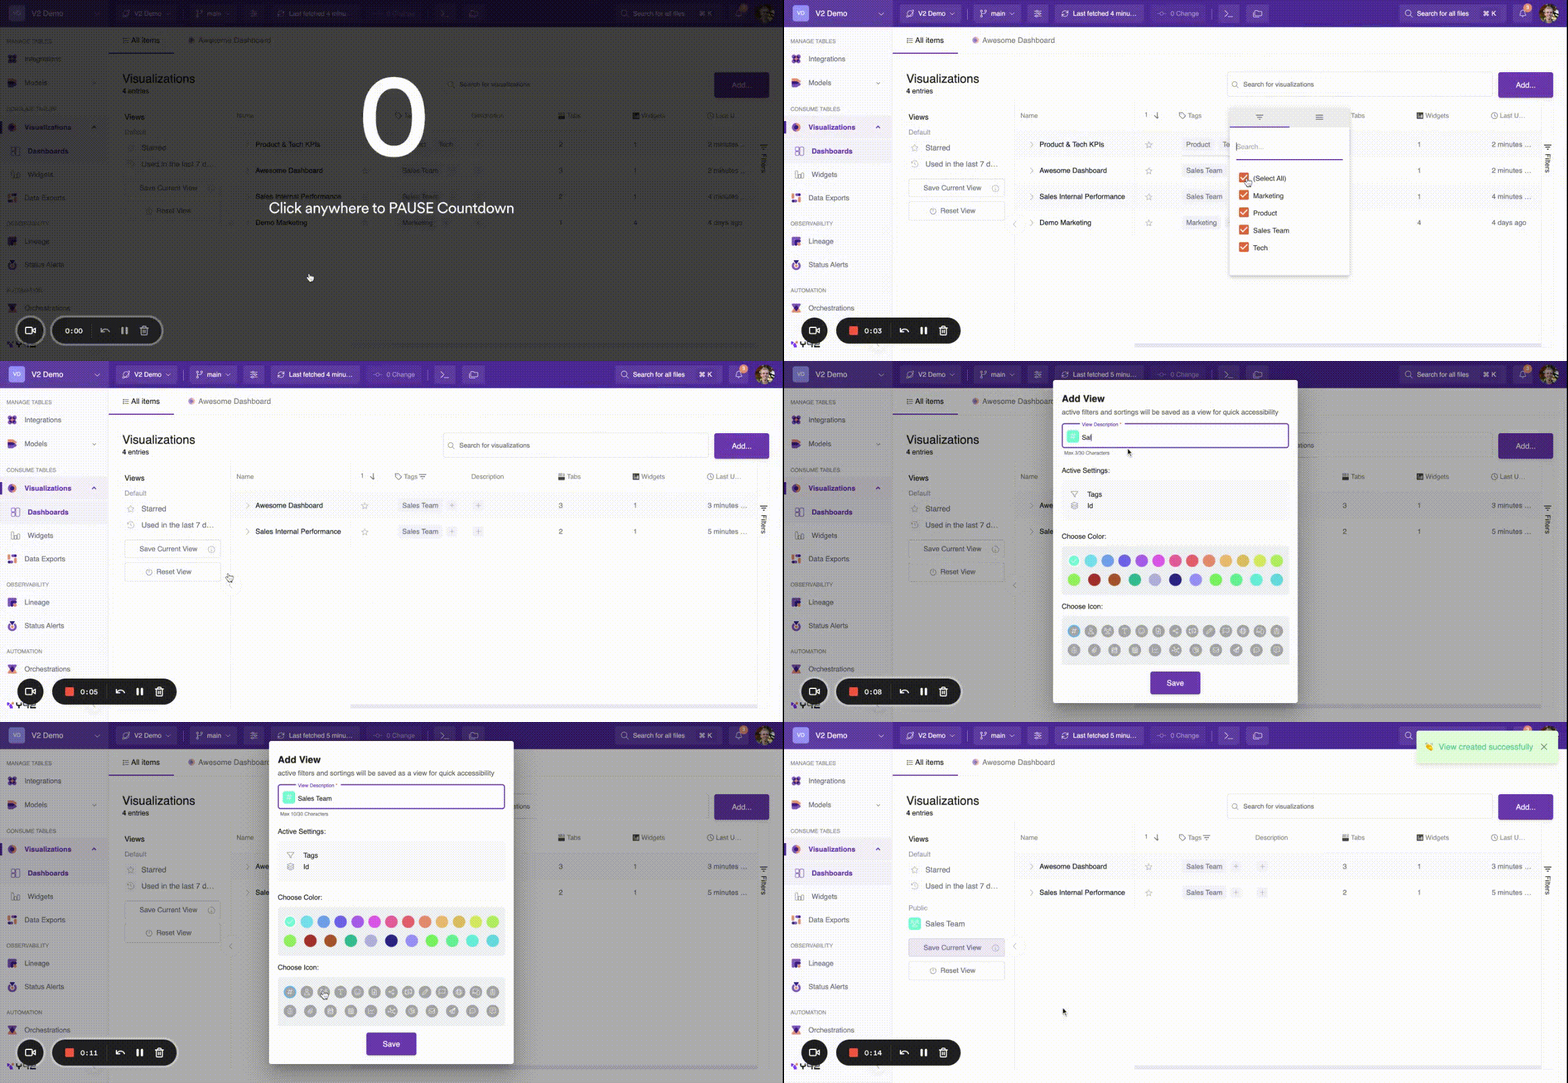
The list of your dashboards is accessible by selecting Visualizations -> Dashboards from the app menu. From here you can use Stars, Tags and Filters to segment your dashboards into different Views.
- Stars allow you to favorite certain dashboards so that they rise to the top of the default dashboard view.
- Tags allow you to create custom classifications for your dashboards which you can later filter by.
- You can Filter your dashboards by Name, Star, Type, Tags, Privacy, Tabs, Widgets, and Last Used.
To save a view, select Save Current View. The view can be saved such that it is Public (Can be seen by everyone within the organization) or Private (can only be seen by you).
Manage Dashboard Access
Each dashboard has a data asset sidebar, which can be used to control which members of your organization have access to that dashboard.
Navigate to the asset sidebar from the dashboard or the dashboard list view, and then navigate to the Access section, from which you can give team members Viewer, Editor or Owner permissions on the dashboard, and create easy to share links for your team.
Needs GIF when ACL implementation finished.
Delete a Dashboard
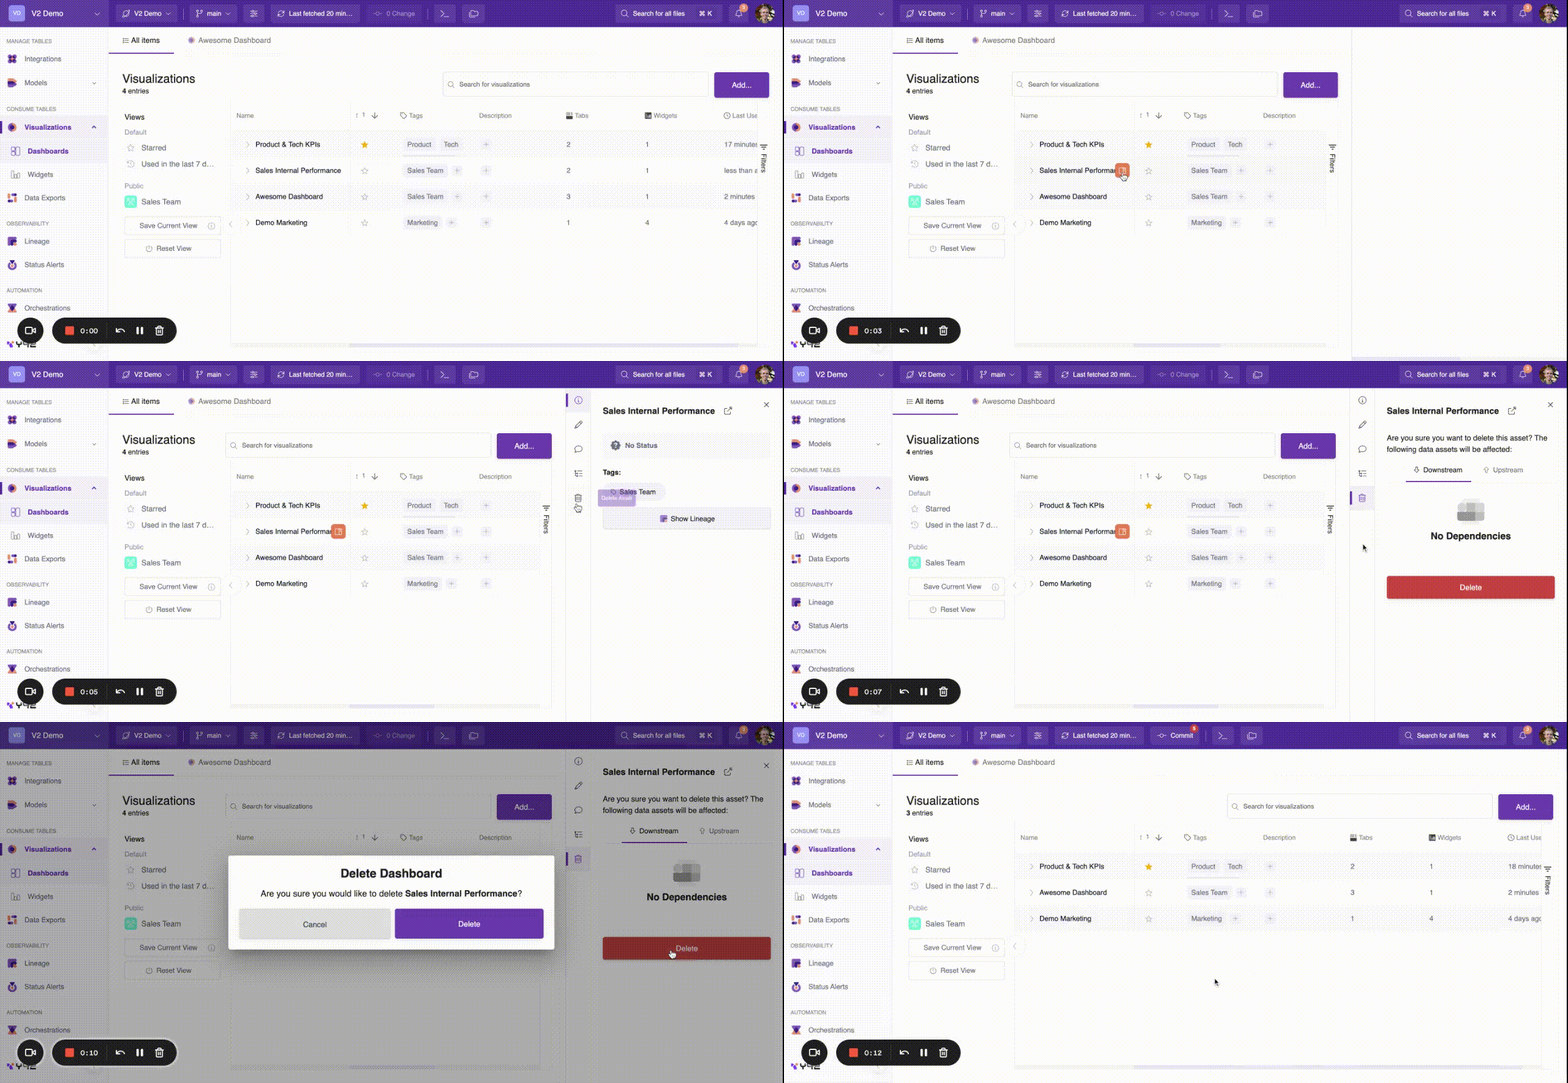
Navigate to the asset sidebar from the dashboard or the dashboard list view, and then navigate to the Delete Asset section to delete your dashboard.
Updated over 3 years ago