How to work with Calculated Fields
Calculated Fields allow users to create metrics for visualizations on the fly. With Calculated Fields, there is no need to go back to the modeling layer to get a ratio or perform small changes.
Basics
Performance
Since metrics are being created on run-time, the performance will always be inferior compared to creating a persisting column with the modeling layer. For columns that users intend to use across multiple widgets, we suggest performing all the calculations in the Model.
How to...?

Calculated Fields are available while you're adding a new widget or editing an already existing one. To use Calculated Fields, follow these steps:
- Open Widget Editor.
- Find Calculated Fields on the left panel with all columns available in a dataset, drag and drop it to Summarize By, Segment By, or Breakdown By.
- Click on the column to open a pop-up window.
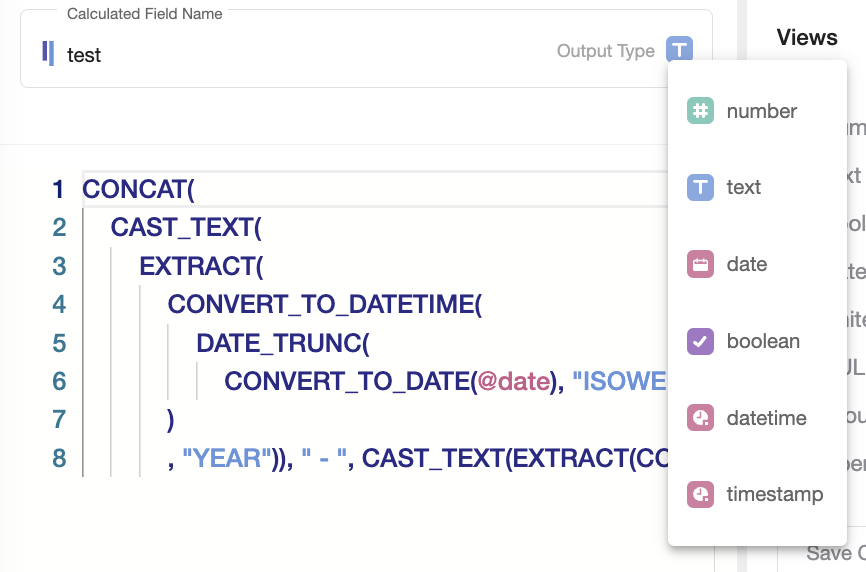
- In a pop-up window, you will find the following fields: name of the new variable, area for applying functions and transformations with columns, the area with available functions, and their descriptions.
- To create new columns, follow the rules:
- Name the column without using Uppercase and special characters other than "_";
- Refer to existing columns through '@';
- Always check for the output type - by default, Y42 sets Numeric type. In case your output is text, change the icon in the Name field.
FYI: It is possible to have more than one calculated field per block (e.g. 2 Calculated Fields under Summarize By). However, keep in mind performance considerations. In case you plan to use alot of such fields, please consider creating them via Model.
Available Functions
On the right side of the pop-up window, you can find a search engine for all the available functions as well as functions by categories of output, including number, text, boolean, date + time. Below we will describe some of them, just to give you a flavour.
Number Functions
If Number Functions are applied, then the expected output is a numeric column. The most common examples of functions are:
- Aggregations: MIN, MAX, COUNT, AVG, SUM;
- Dates: DATETIME_DIFF - calculates the difference between two dates in a specified format (days, hours, etc.);
- Rounding: ROUND, TRUNCATE;
- Operators: ADD, DIVIDE, MULTIPLY, SUBTRACT;
- Converting to float or integer numbers: CAST_FLOAT, CAST_INT.
For computations, you can also find trigonometry and math functions.
Text Functions
Text Functions are basic yet powerful Natural Language Processing (NLP) tools. With these functions users can:
- Convert any value to text: CAST_TEXT;
- Convert to upper- or lower- case: UCASE, LCASE;
- Replace text elements with specified: REPLACE;
- Combine two or more text elements in one: CONCAT.
Boolean Functions
Boolean Functions give as an output values 'True' or 'False'. You can treat them as functions that check for particular statements to be true:
- Check whether text inputs contain, start with or end with certain characters: CONTAINS, ENDS_WITH, STARTS_WITH.
- Logical operators, such as AND/OR, in combination with EQUALS.
- Operators, including BETWEEN, LESS_THAT, IS_NULL.
Date + Time Functions
Date and Time Functions are great tools for turning dates to desirable forms and structures. For example, users can:
- Convert any text to dates: PARSE_DATE;
- Aggregate or disaggregate dates to a specified granularity (e.g., to ISO weeks): DATE_TRUNC;
- Add or subtract days or weeks: DATETIME_ADD, DATETIME_SUB.
Any Type Functions
Such functions return output of the type of the input. With such functions, users can:
- Check for NULL values and replace them with specified values/characters: NULL_IF;
- Return one or another value, depending on whether a condition is TRUE or FALSE: IF;
- Replace NULL values of one column with non-NULL values of another column: COALESCE.
We encourage you to take time and explore all the available functions in Calculated Fields to create beautiful and insightful widgets with Visualize.
Calculating Ratios
It is often the case that performance metrics are ratios that need to be calculated on aggregated data. Calculated fields make it possible to use a table with a higher granularity and calculate the metric on aggregated data by aggregating the individual metric components, thus maintaining the weight of the denominator.
What is the difference between an aggregated calculated field and a calculated field with aggregated components?
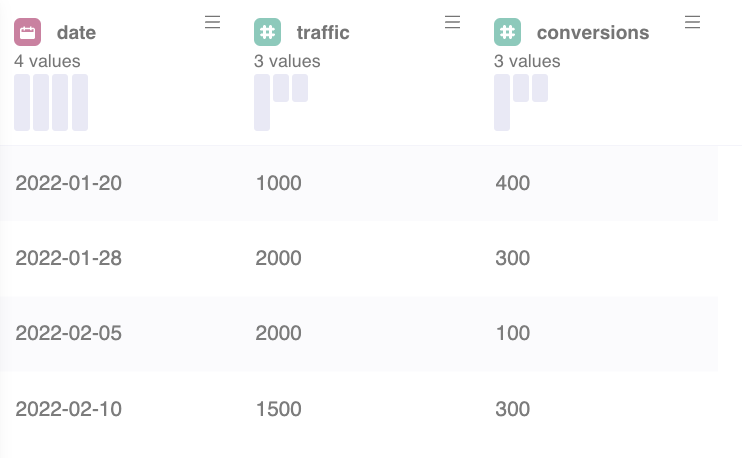
For example, let's say we want calculate the monthly e-commerce conversion rate from a day-level table of conversions and traffic, which looks as follows:
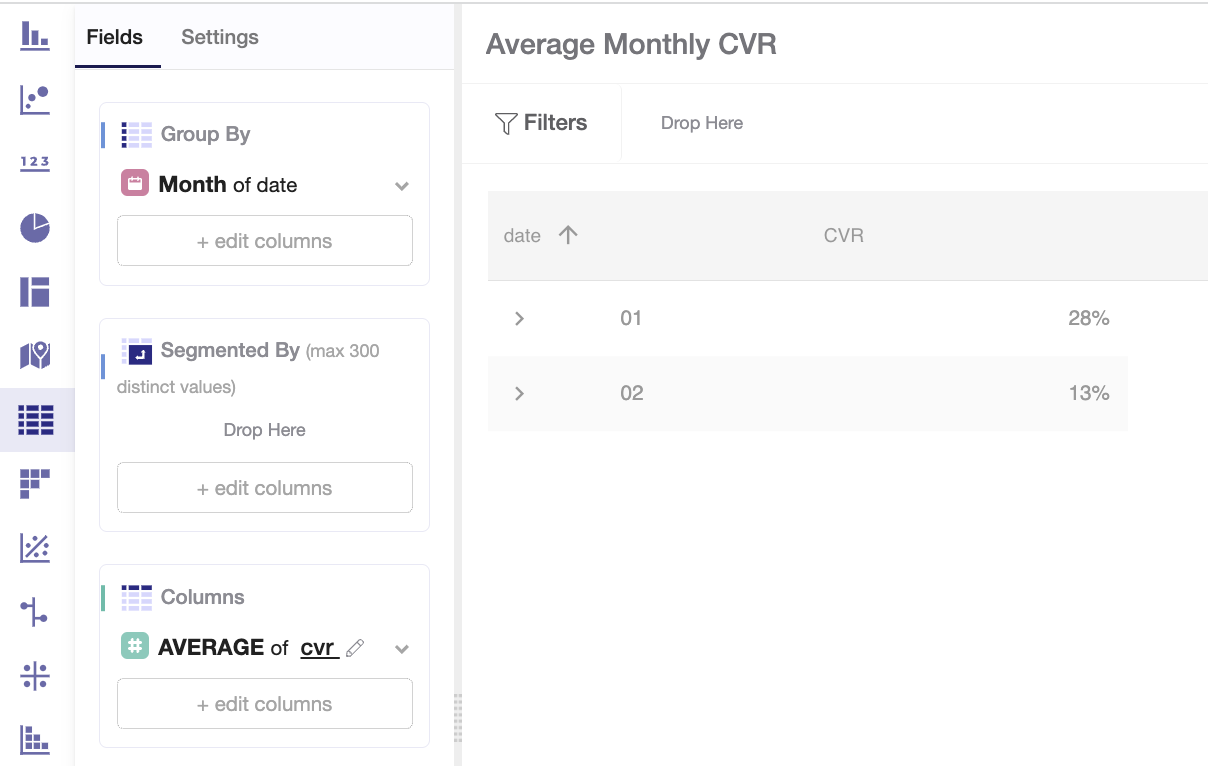
Calculating the conversion rate [ CVR =@conversions/@traffic] and aggregate it as average [AVG] on monthly level, results in:
Instead, aggregating the single component of the conversion rate in the formula [CVR = SUM(@conversions)/SUM(@traffic)], gives the following result:
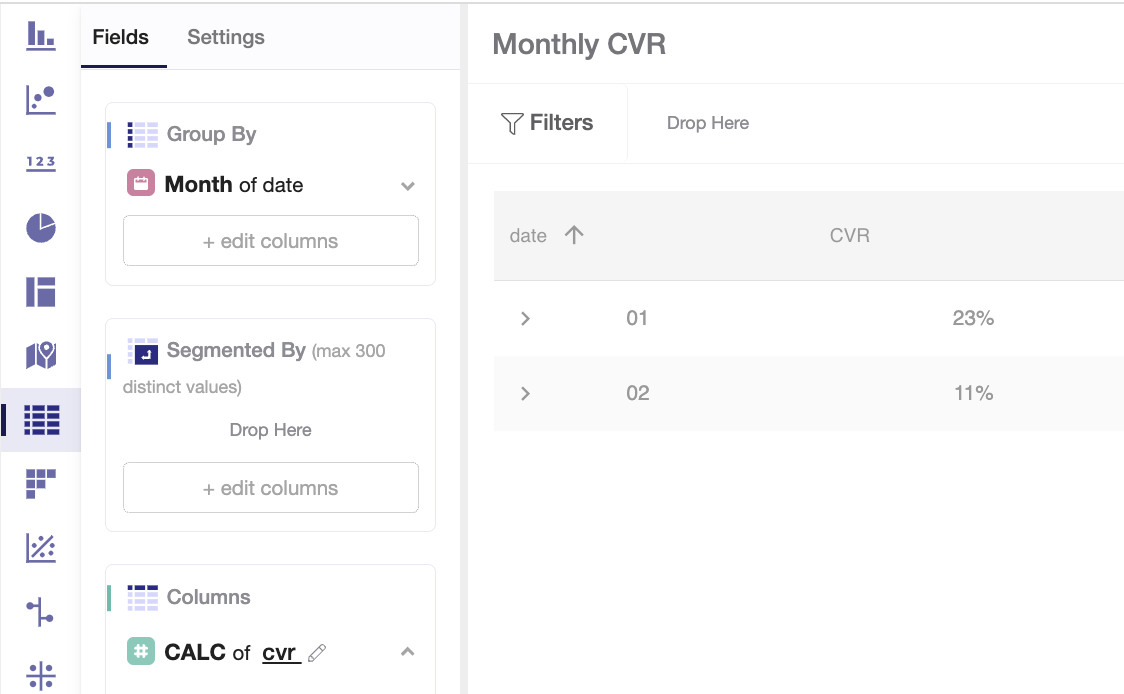
Since traffic is not constant, the second case accurately depicts the monthly value of conversions over traffic.
Example: Monthly share of returning customers
Below you will find an example of a comprehensive use case where calculated fields and in-widget filters are used to calculate the monthly share of returning customers starting from an order-level table.
CALCULATED FIELDS EXAMPLE - Watch Video

Updated almost 4 years ago