How to work with Widgets
Here we give a quick guide on how to set up your first widget. For the full details on all widget settings, see the Visualizations Reference Documentation.
Create a Widget & Select a Data Source
Visualization widgets are the main component of your dashboards and allow you to quickly visualize your data and dive deep into data analytics.
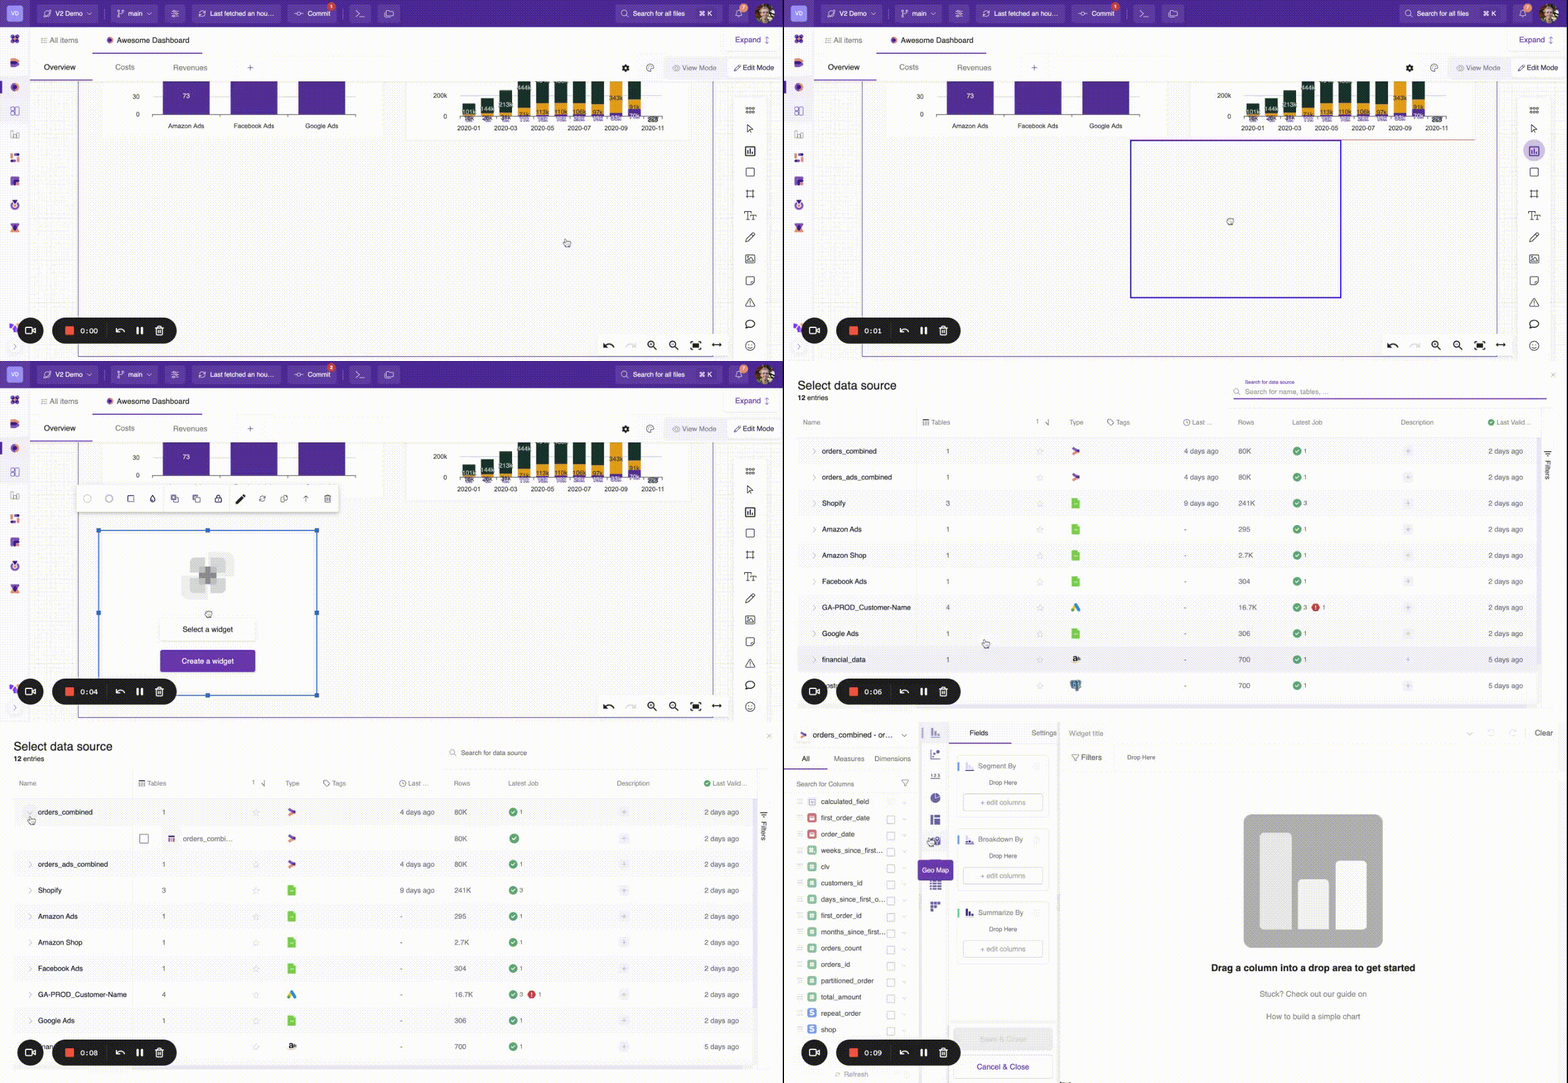
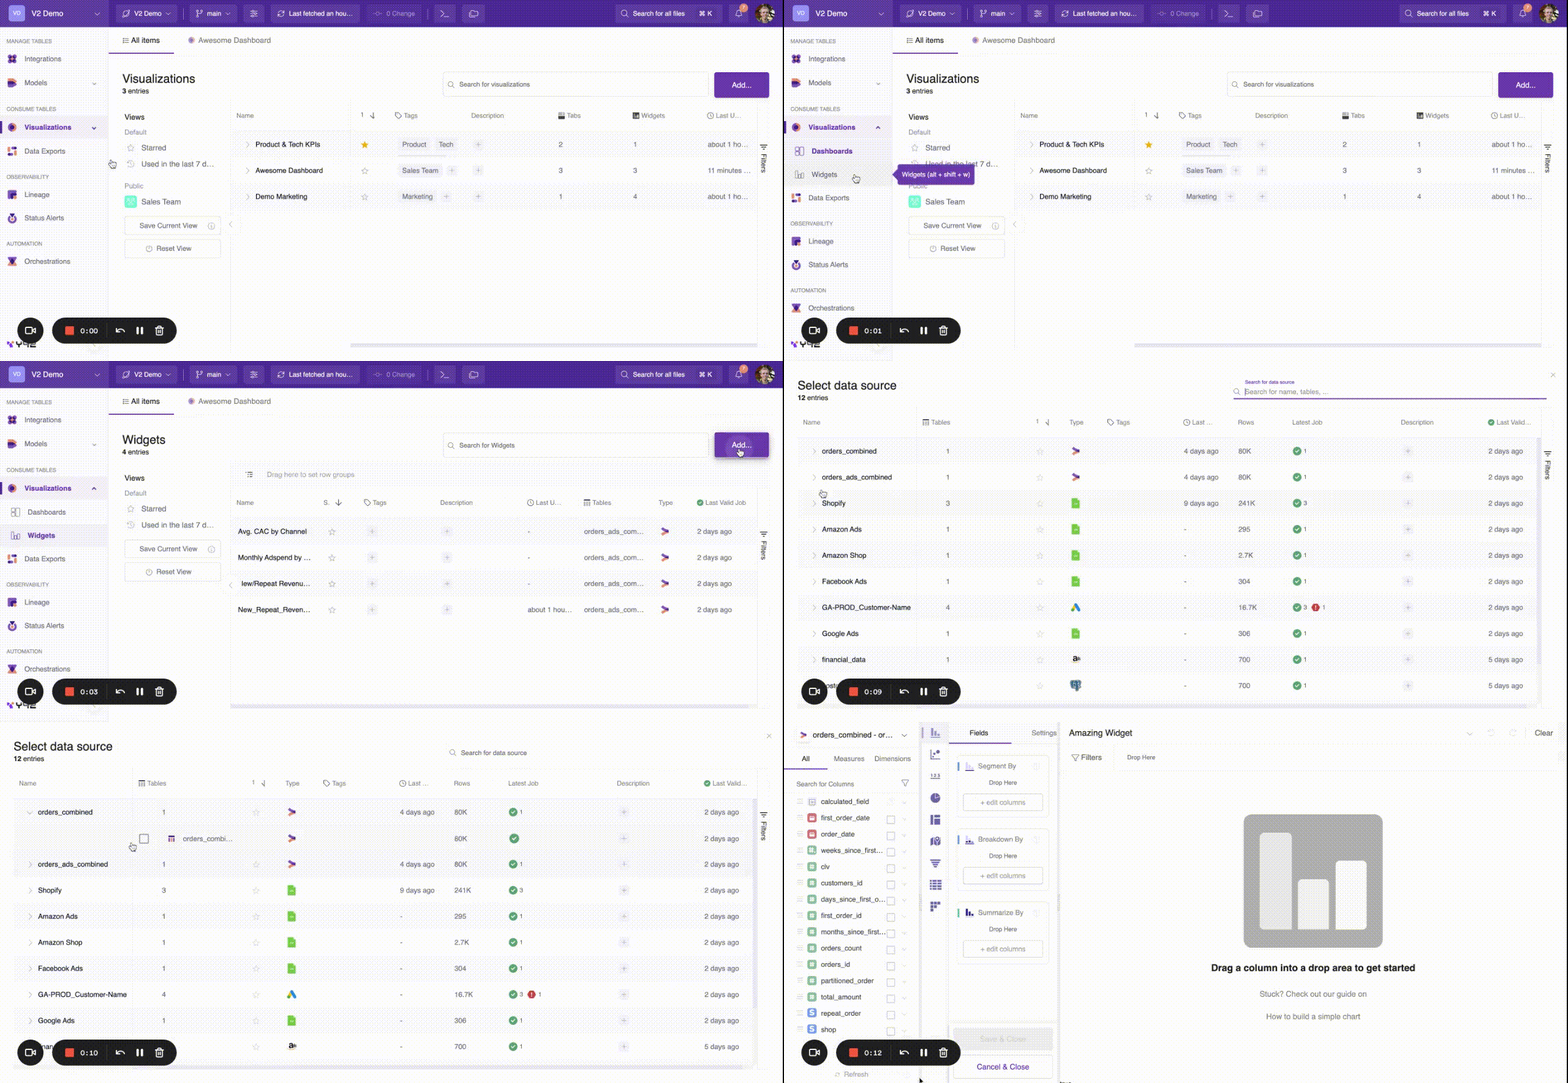
You can create widgets inside a dashboard tab or directly from the Widget List View
Inside a dashboard tab:
- Go to Edit Mode
- Select the widget icon from the canvas toolbar and place the widget on the canvas
- Select 'Create a Widget'
- Select a data table to create a widget from the list presented to you. You can use output tables from models or select tables directly from integrations.

In the Widget List View:
- Select Add...
- Select a data table to create a widget from the list presented to you. You can use output tables from models or select tables directly from integrations.

Build a Widget
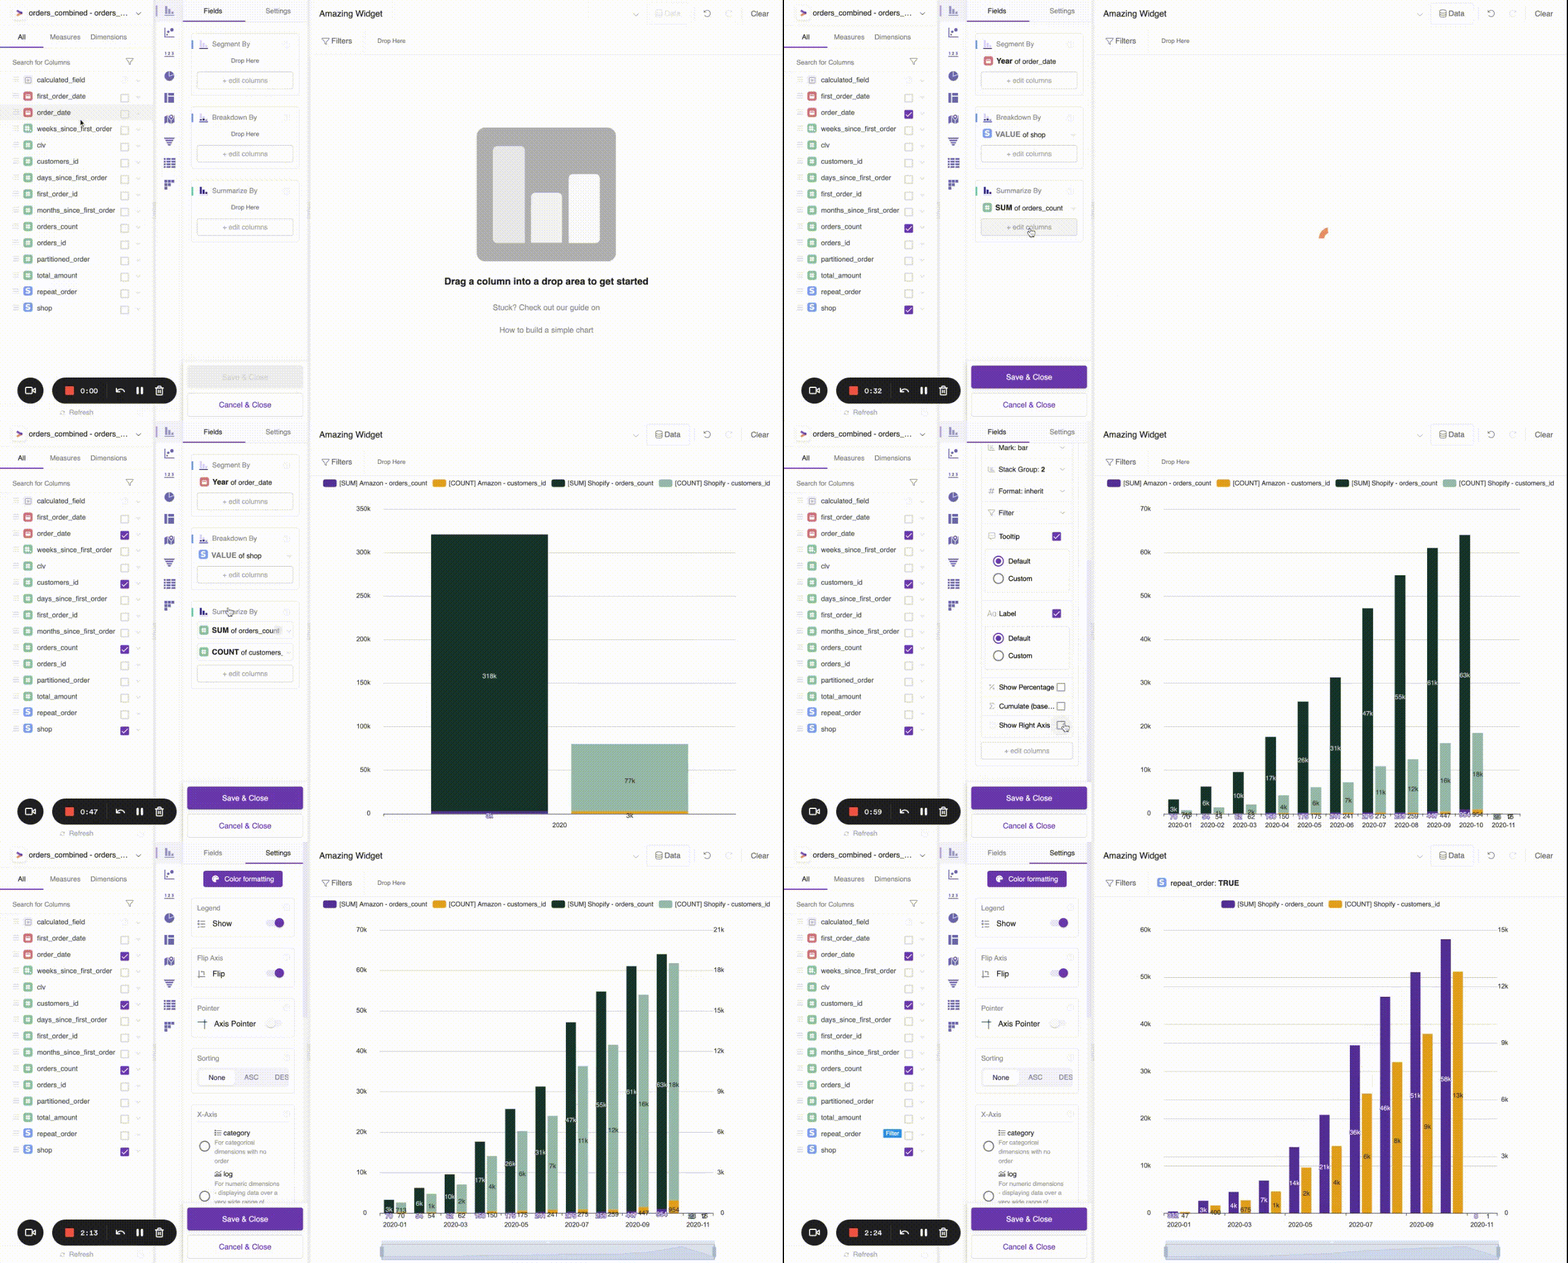
You can a build a widget in 2-5 simple steps.
-
From the list of fields, select all Dimensions, Measures or Calculated Fields that you wish to use in your widget. This can be done in one of 3 ways:
- By dragging the field into your chosen drop area
- By selecting the check mark next to the field, allowing Y42 to suggest a drop area for the field
- By selecting 'Edit columns' in your chosen drop area
-
Choose your widget type. Currently, we support Simple Charts, Scatter Plots, Number Boxes, Pie Charts, Treemaps, Tables (simple & pivot), and Cohort Tables.
-
If necessary, change the settings for an individual field.
- To change display settings, go to the field settings dropdown next to the field
- To change the aggregation type for a field (e.g. AVG, SUM, YEAR, YEAR & MONTH), hover & select the aggregation text
-
If necessary, change widget-level settings such as the axis display format. To do this, head to the settings tab for the widget. Note that these settings overwrite global settings you apply on a dashboard level.
-
If necessary, apply filters on the displayed widget. These filters are applied in addition to any dashboard filters. To do this, either:
- Drag the filtering field into the filters drop area
- Select the Filters button in the widget builder
Lastly, don't forget to save & close your widget! You'll need to give it a name, and you can give it a description if you would like.

Reference Documentation
For much more information on all settings in the Widget Builder, head to our reference documentation on the following topics:
Updated over 3 years ago