Bottom Drawer
What is the bottom drawer?
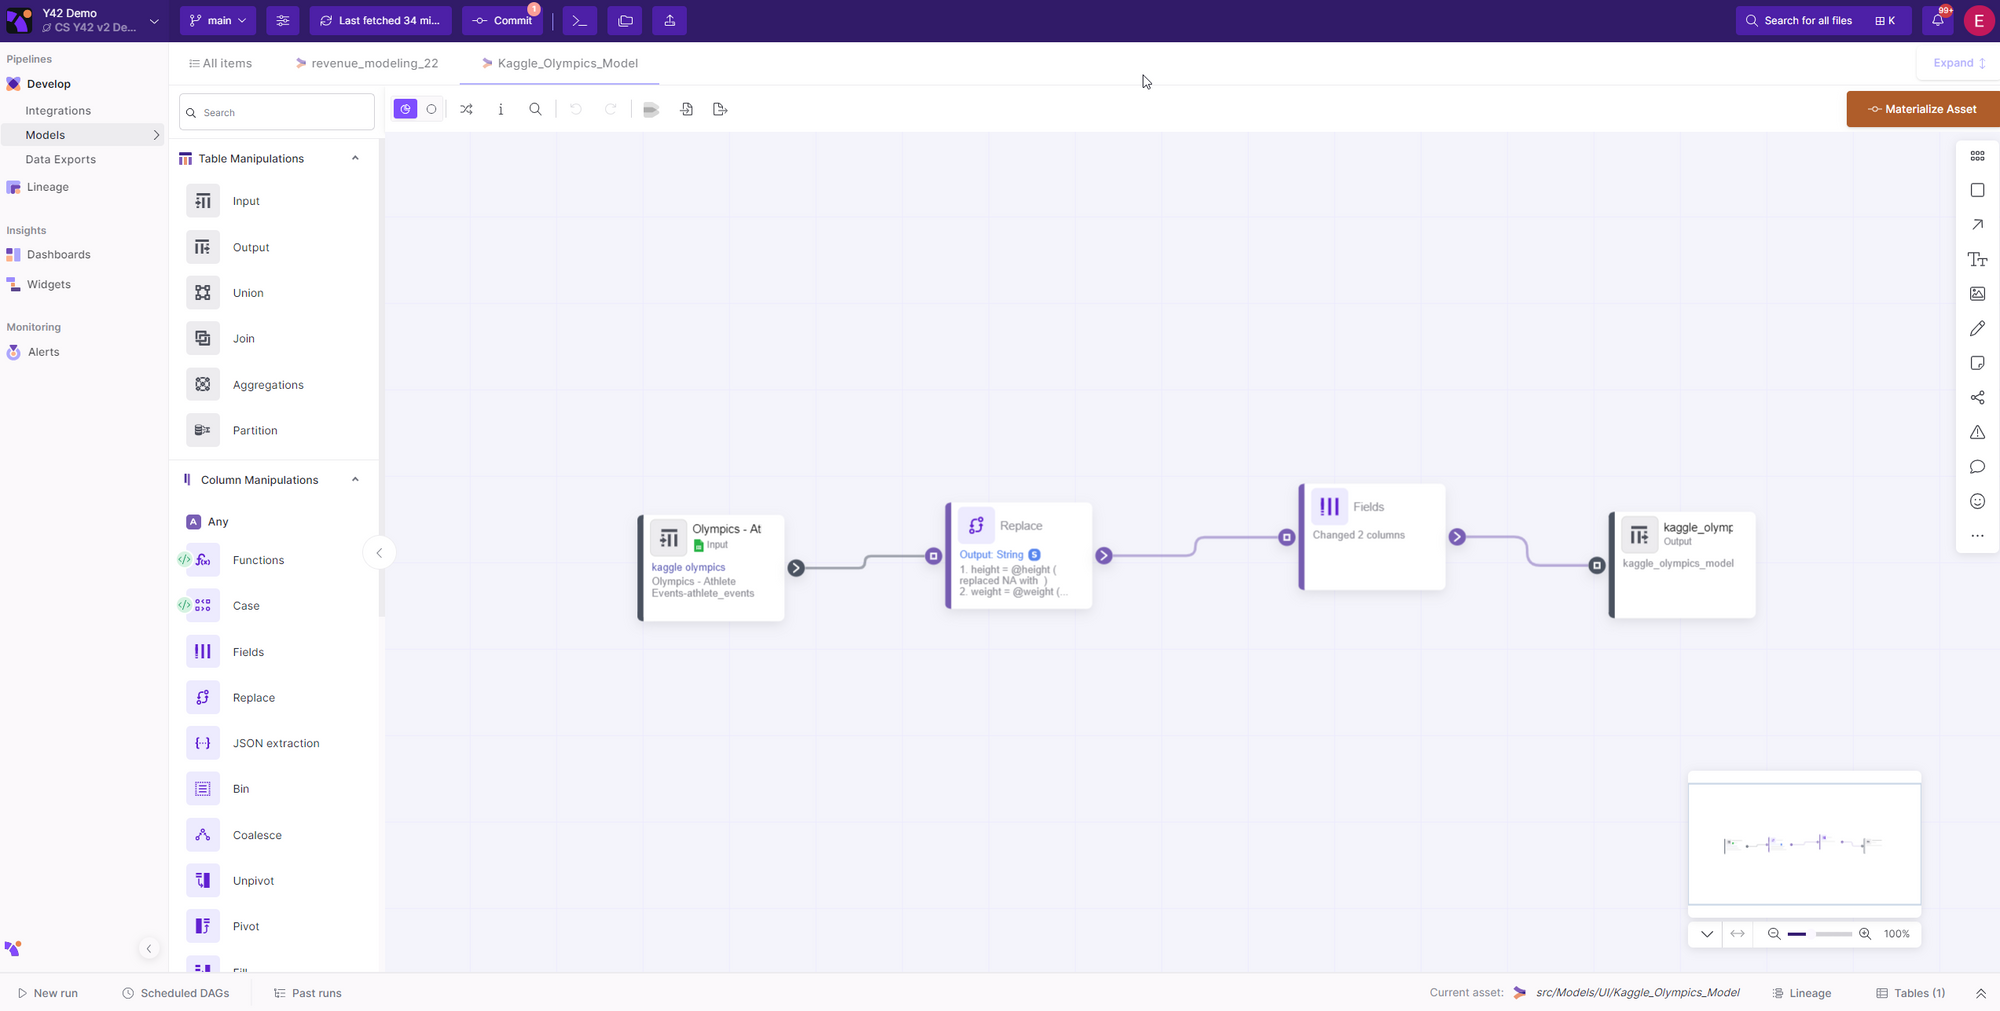
The bottom drawer is a feature in the Y42 platform that provides users with an intuitive way to access information about an asset. This includes details such as past runs, scheduled dags and data tables. Within the bottom drawer, users can create new runs or schedule new runs relative to the asset and its dependencies. These assets include Integration, UI-models, SQL models and Data Exports.
How does it work?
When you open an Asset in the Y42 platform, such as a specific Integration, UI model, SQL model or Export, the bottom drawer will display all relevant information about that asset and its dependencies. This allows you to easily access and manage important details about your assets in one convenient location.
Let's now introduce the bottom drawer by all its elements:
1- Asset Overview.
You can access any Asset and open its bottom drawer.
2- Expand/Minimize bottom drawer button.
Click the “Up sign” button in the bottom left of the app to expand the bottom drawer.
Click the “Down sign” button to minimize the bottom drawer.
3- Table button
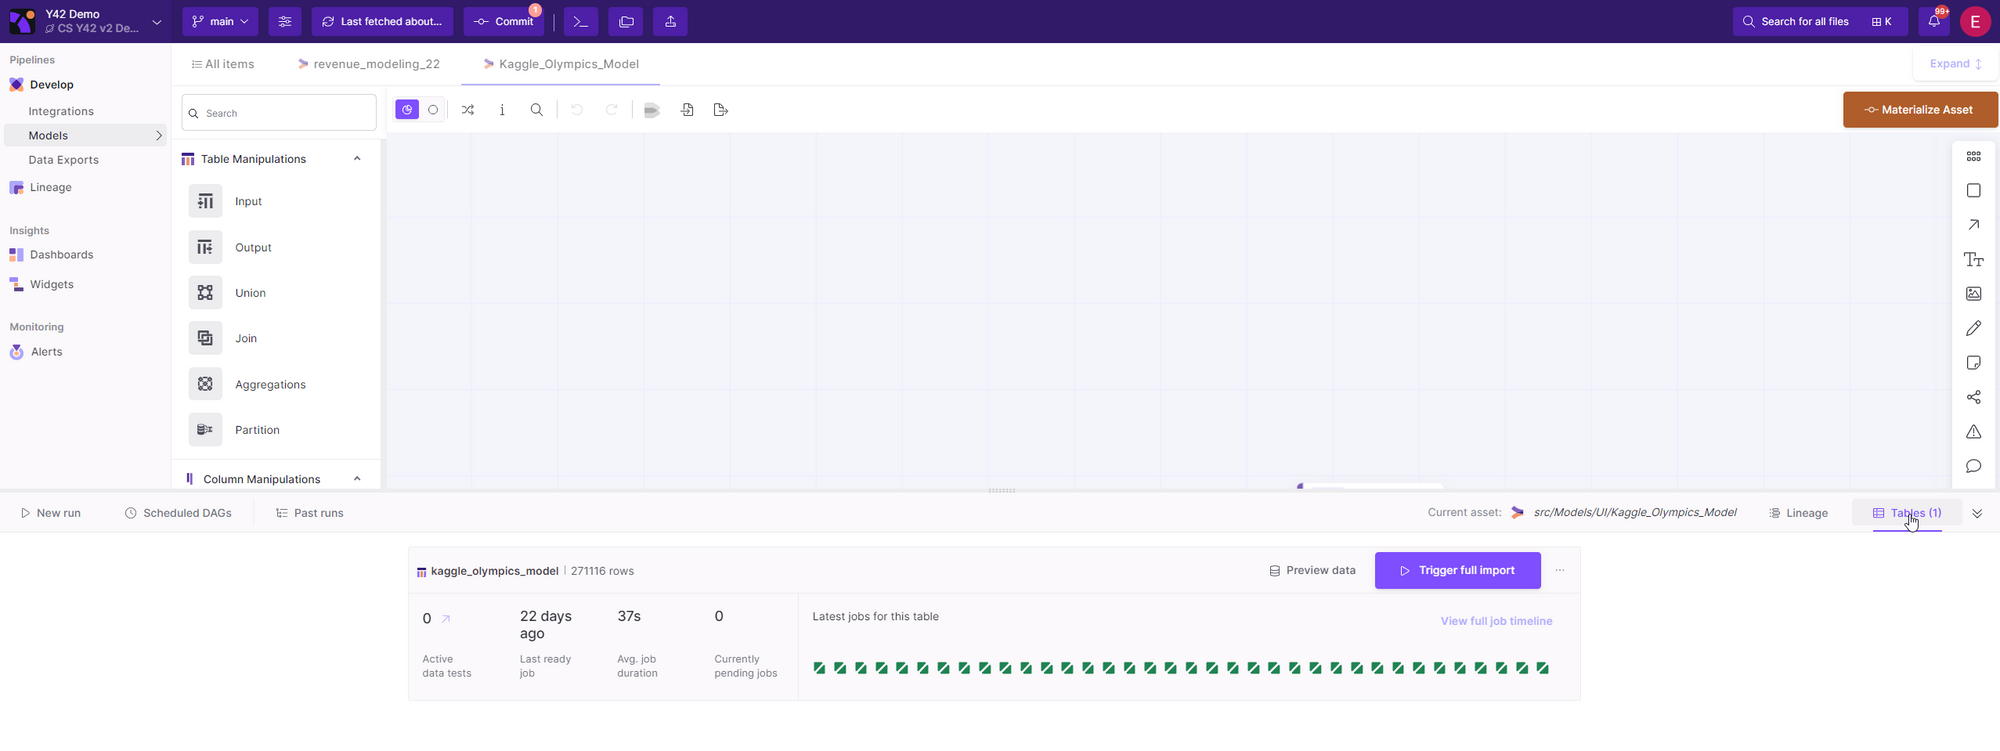
In the Bottom drawer you can view all jobs that have been triggered for a specific table by clicking on the table button.
💡 From here, you can also preview the data by clicking on **preview data**.-
Other information available includes:
-
The number of active data tests for this table
-
The last ready job
-
Average job duration
-
Currently pending jobs
-
The number of actual rows.
💡 You can view a timeline of jobs in a calendar-like fashion by clicking on the **full job timeline**. From this view, you can filter jobs by date to show only those that you are interested in investigating. This allows you to easily track and manage your jobs over time. 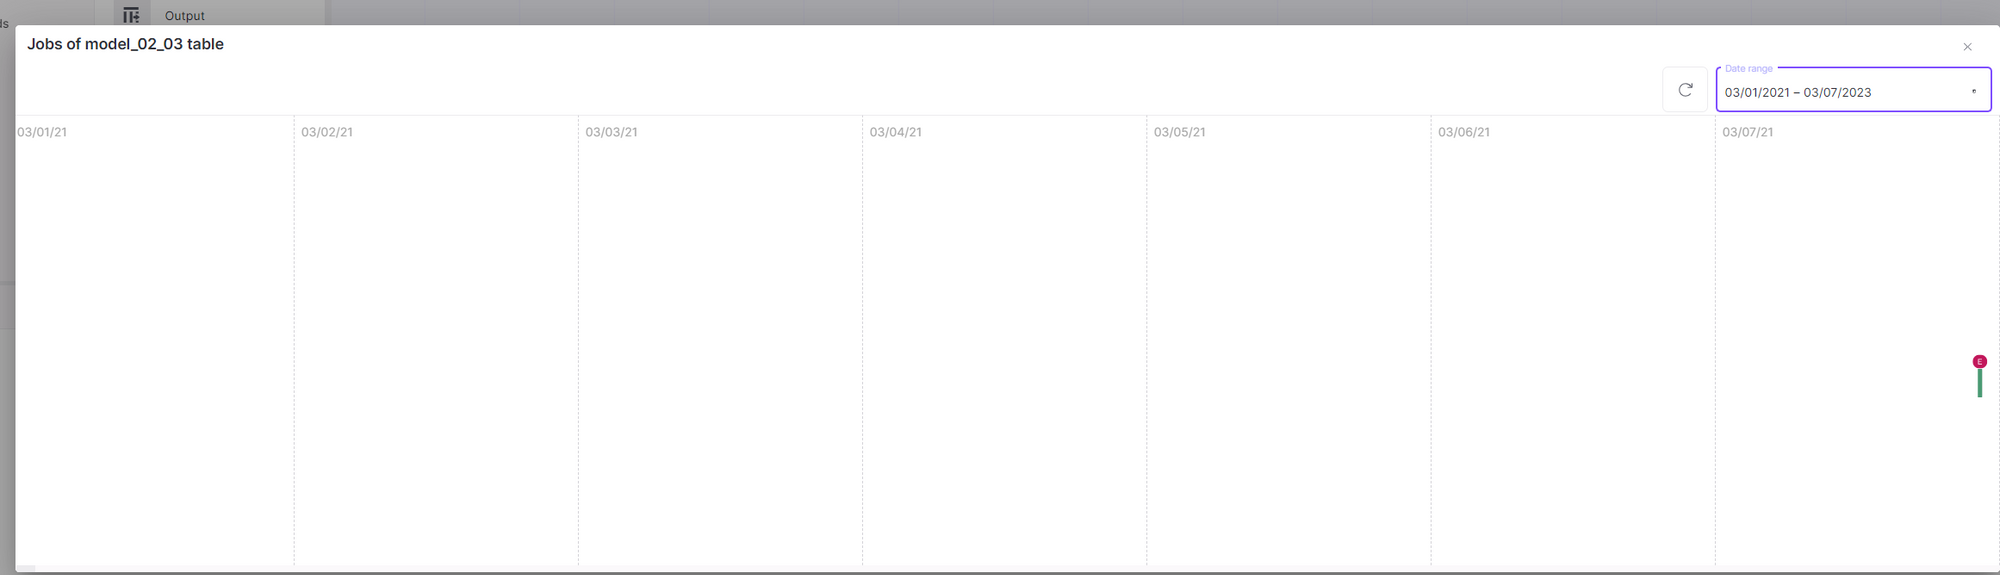
-
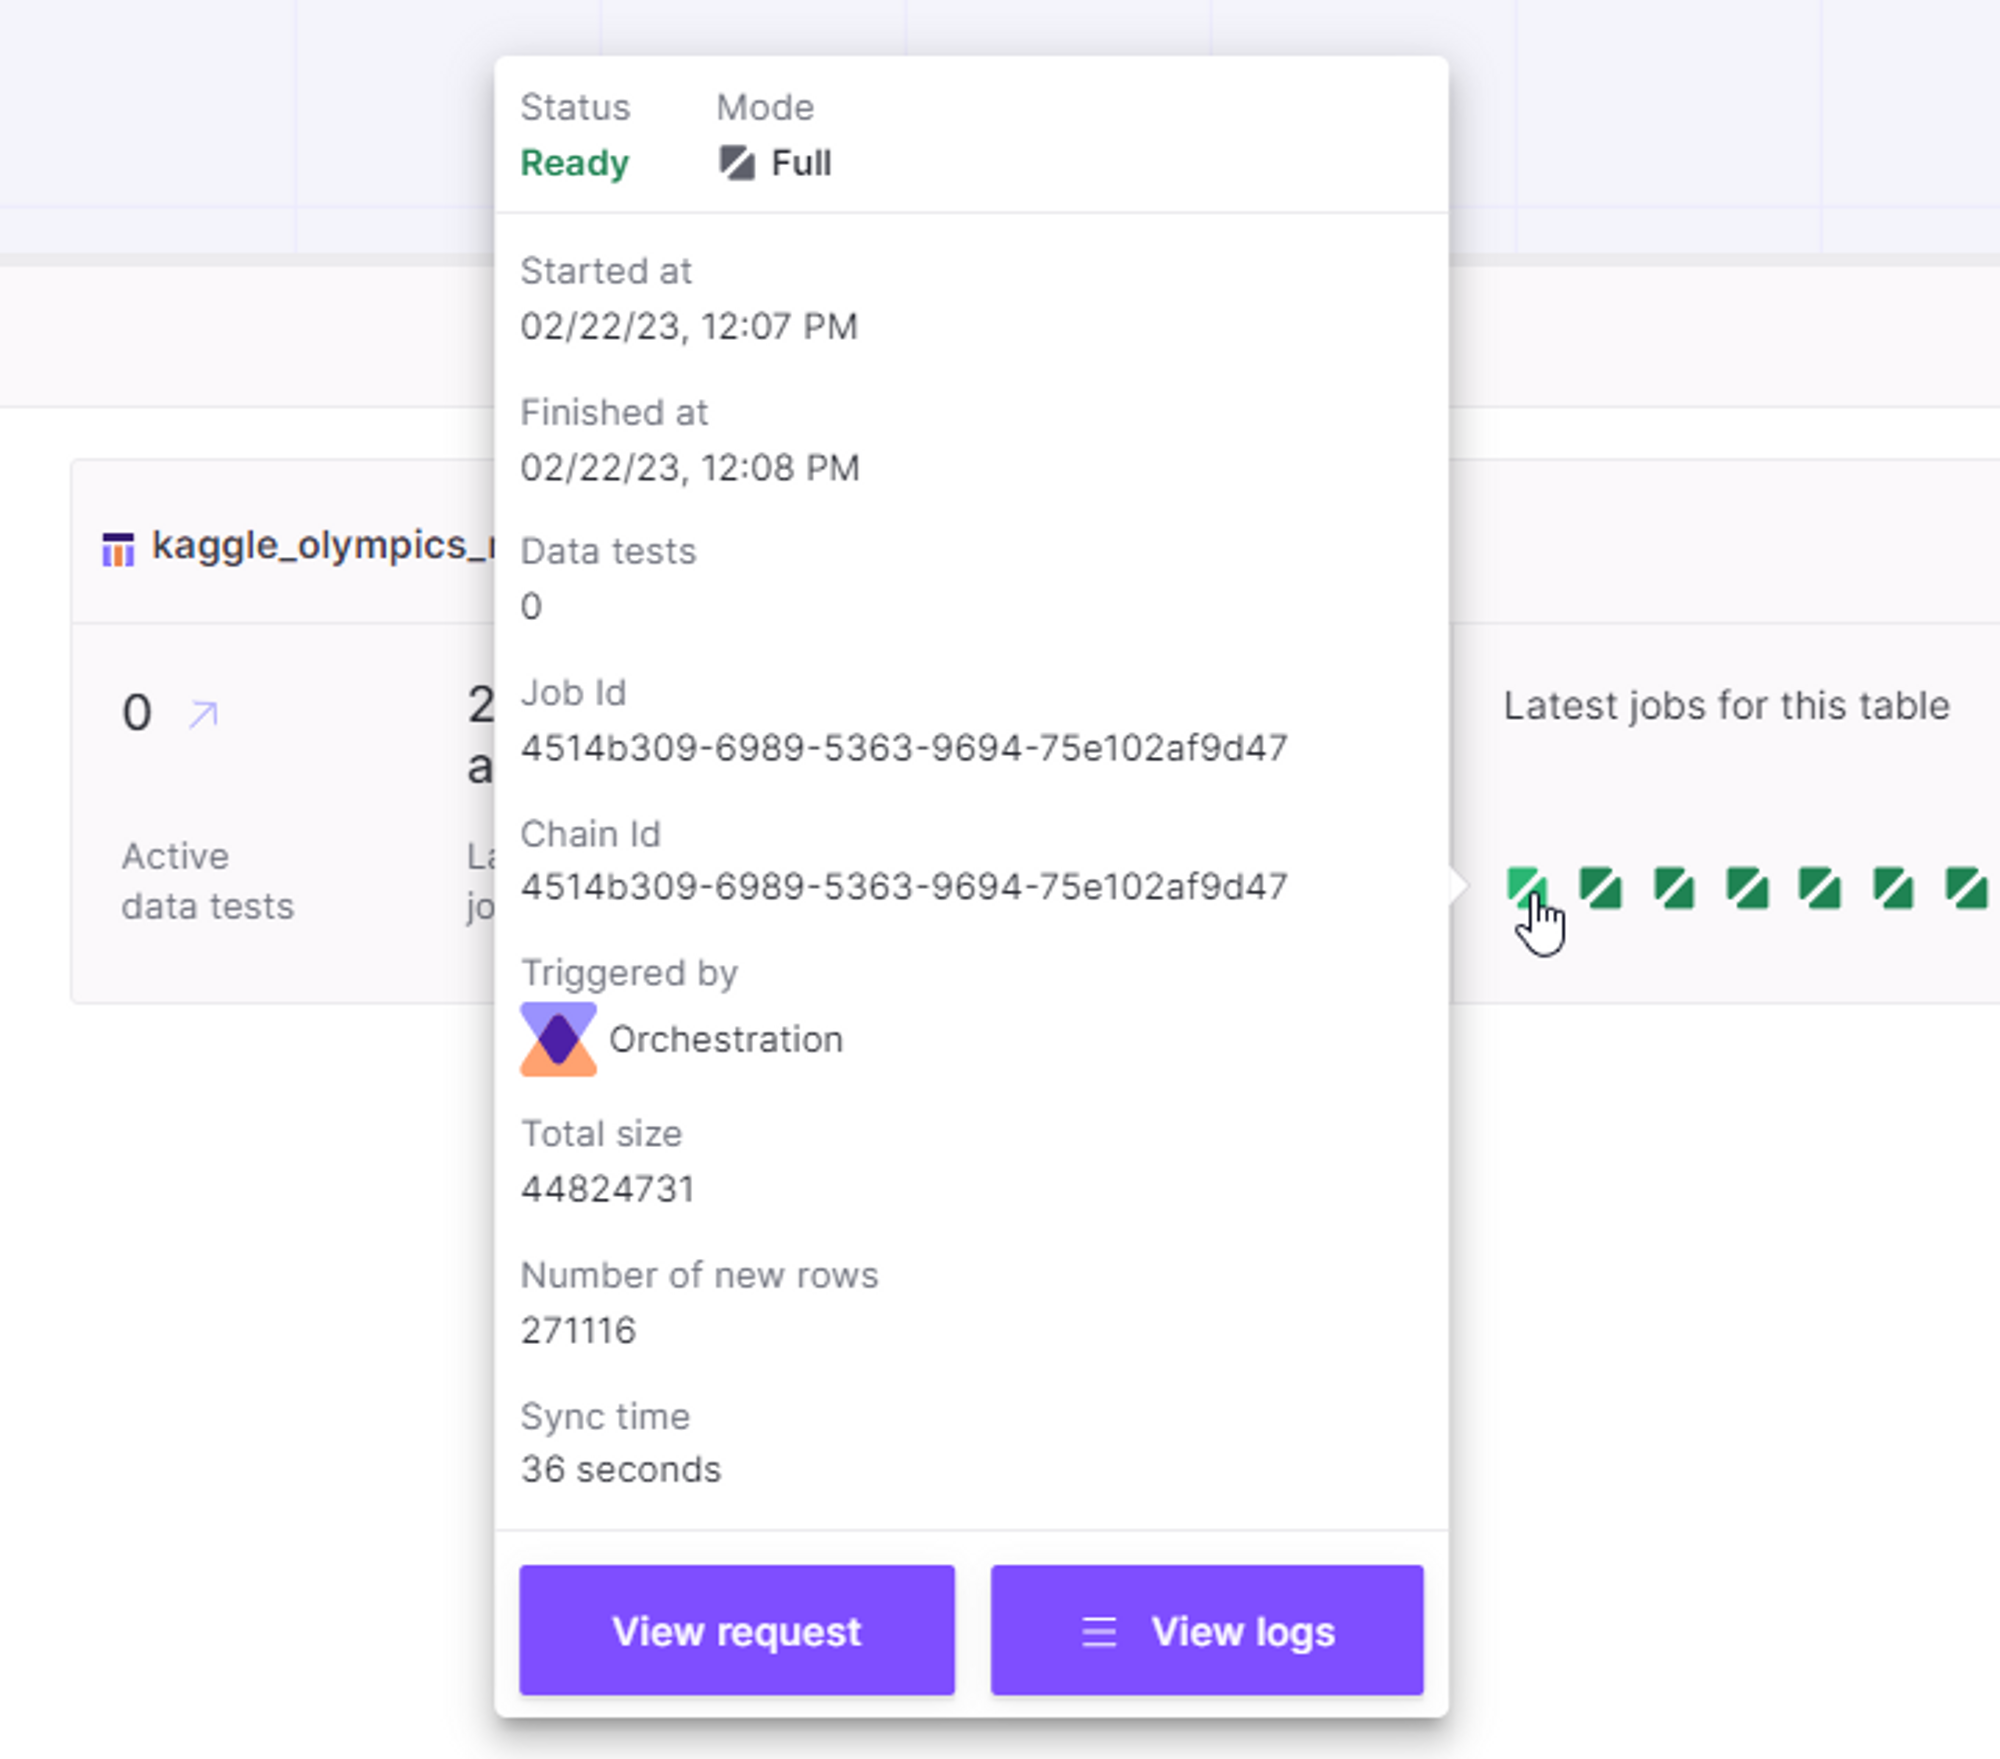
In the Jobs View, you can view detailed information about each job by hovering your cursor over it. This will display information such as:
- The job’s status
- The mode (Incremental or Full)
- The start and finish times
- The Job ID and Chain ID
- Who triggered the job (Orchestration or a specific user)
- The total size of the data processed
- The number of new rows added
- The sync time.
Additionally, from this view you can also access the request and view the logs for this specific job. This allows you to easily track and manage your jobs and their associated data.
Additionally, you can perform several actions from this view, by clicking the three horizontal dots:
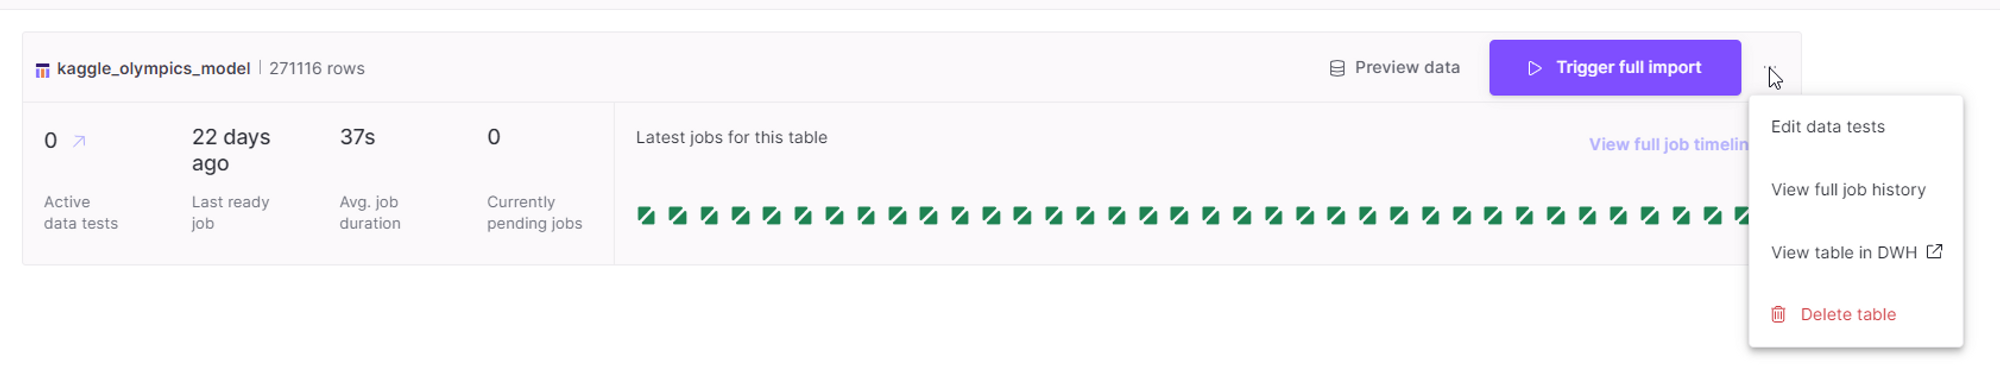
- Triggering a full import of data
- Editing or adding data tests for this table
- Viewing the table in your Data Warehouse
- Deleting the table entirely.
4- Lineage button
The Lineage feature in the Y42 platform provides a visual representation of all upstream and downstream dependencies for a given asset. This allows you to see the full picture of how data flows through your system and how different assets are interconnected. By understanding these dependencies, you can more effectively manage your data and ensure its accuracy.
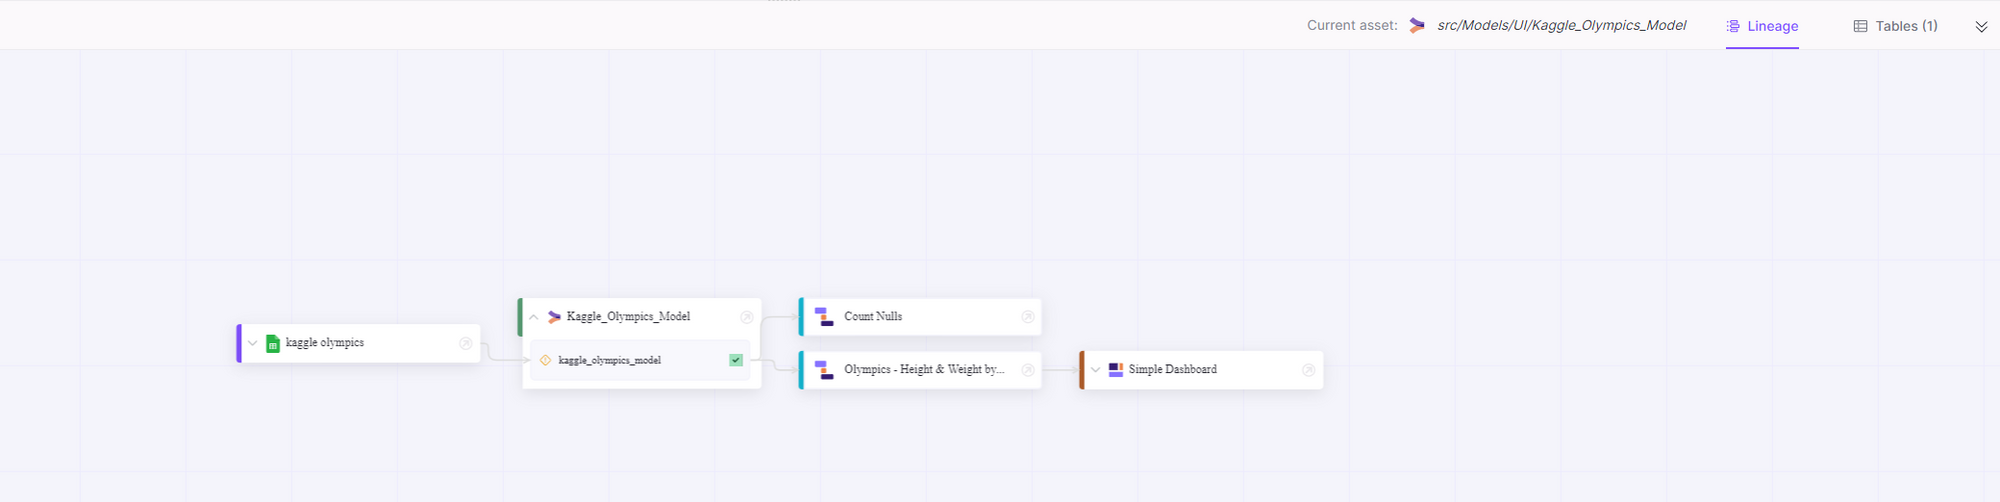
5- Current Asset
To ensure that you are viewing the correct asset, the current asset feature shows the actual path of the asset. This allows you to easily identify which asset the bottom drawer belongs to and ensures that you are accessing the correct information.
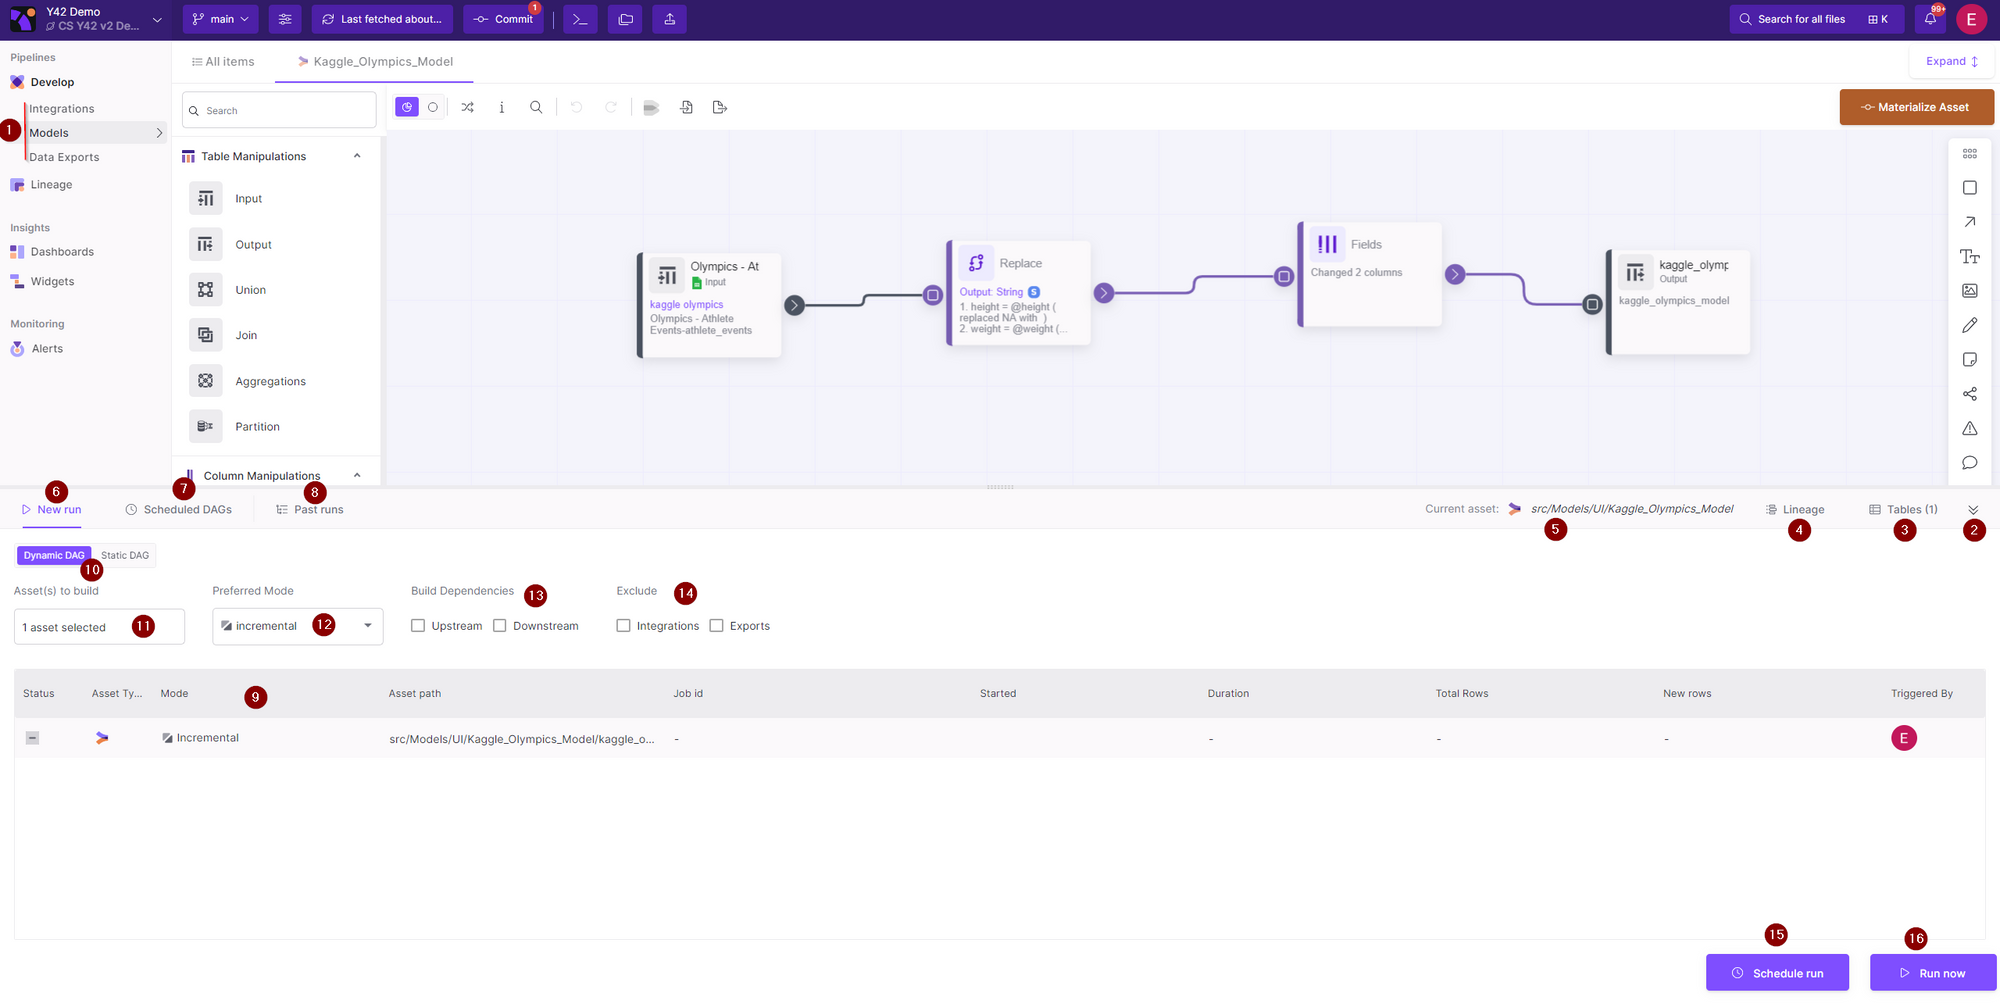
6- New Run
In the Y42 platform, the New Run button allows you to select assets for which to run jobs. By default, the current asset will be preselected. From here, you have several options:
I. Create a Dynamic DAG:
To create a Dynamic DAG,
- First select the asset(s) that you want to import or update.
- Next, build dependencies between these assets as needed.
Upstream or Downstream (If needed)
Exclude Integrations or Exports (If needed) - Choose your preferred mode (Incremental or Full import).
- Finally, schedule a run or choose to run the job immediately.
II. Create a Static DAG:
- With a Static DAG, you can also choose your preferred mode (Incremental or Full import) for running the job.
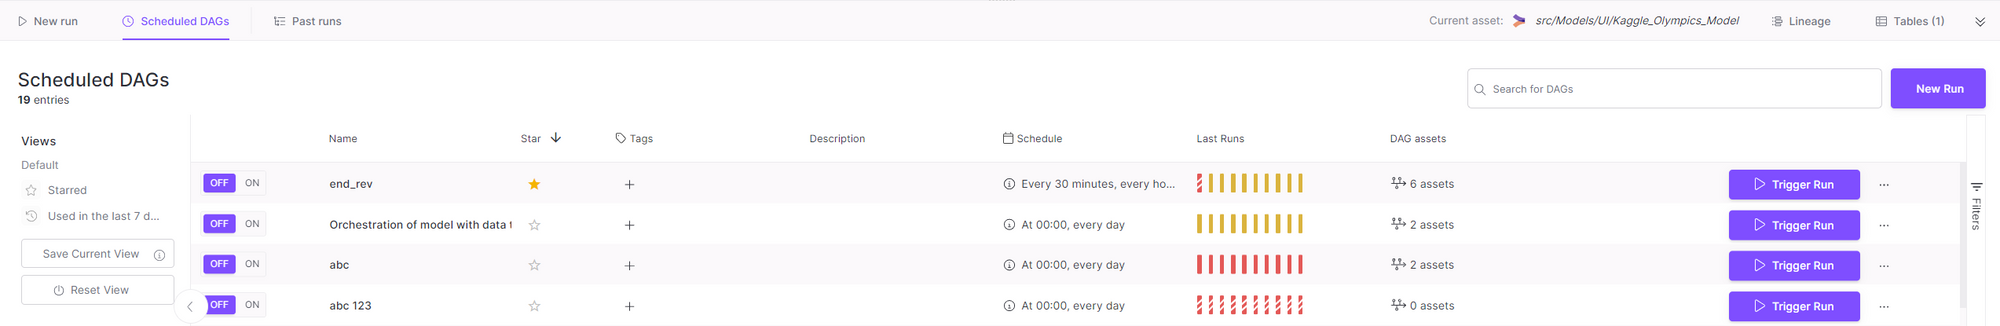
7- Scheduled DAGs
You can view all existing DAGs by clicking on the Scheduled DAGs button. These DAGs are not specific to any particular asset. From this view, you can:
- Turn individual DAGs on or off.
- Trigger a new run for a specific DAG.
- View the name of each DAG.
- Star a DAG (make it a favorite).
- View or add tags and descriptions for each DAG.
- View the schedule and last runs for each DAG.
- See the number of assets associated with each DAG.
- Delete the DAG, by clicking the three horizontal dots.
This allows you to easily manage and track your scheduled DAGs and their associated data.
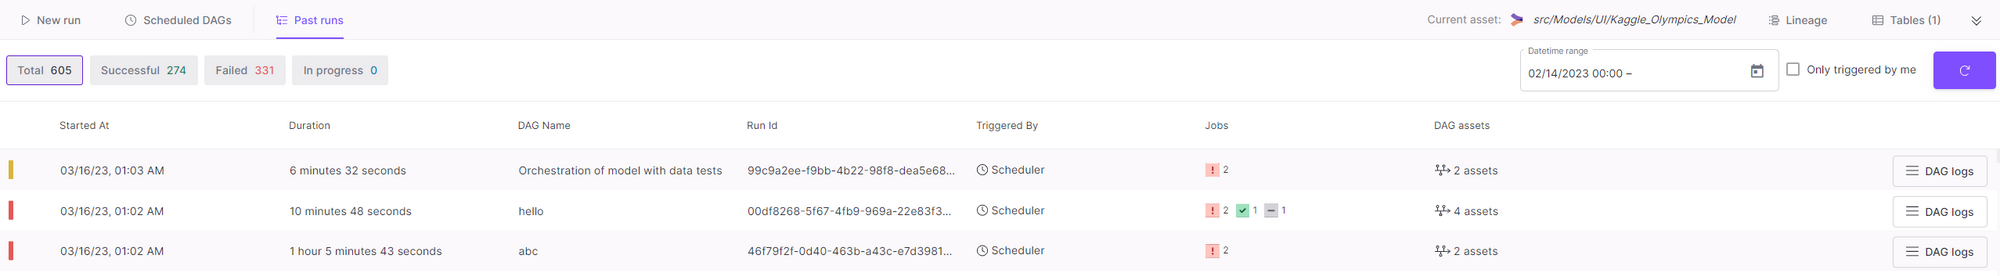
8- Past Runs
By clicking on the Past Runs button you can view all past runs . These runs are not specific to any particular asset. From this view, you can see information such as:
- The start time and duration of each job
- The name of the associated DAG
- The Run ID
- Who triggered the job (Scheduler or a specific user)
- The number of jobs grouped by status
- The number of assets associated with each DAG
- The logs for each DAG.
Additionally, in the top bar you can see an overview of the total number of jobs, successful jobs (Ready or Partially Ready), failed jobs (Invalid, Partially Invalid or Canceled) and in-progress jobs.
You can also filter your view by date range using the filter in the top right corner of the bottom drawer or choose to only show jobs that were triggered by you.
9- Jobs table Section
****In this section all the relative tables belonging to the asset appear.
From this view, you can see information such as:
- Status of the last Job
- Asset type
- Mode (Incremental or Full)
- Asset Path
- Job Id
- Started At
- Duration
- Total Rows
- New Rows
10- Dynamic Dag/Static Dag button
Dynamic DAG (Dynamic directed acyclic graph)
Dynamic DAG (Dynamic directed acyclic graph), shows a quick way to build a CI/CD pipeline of data.
Important note! The dynamic dag changes during pipeline changes. For example if dependencies change by adding a new model, integration or export everything it is automatically added in the CI/CD pipeline.
To create a Dynamic DAG:
-
First select the asset(s) that you want to import or update (Counter 11).
-
Choose your preferred mode (Incremental or Full import). (Counter 12)
-
Next, build dependencies between these assets as needed.(Counter 13)
Upstream or Downstream (If needed).
💡 **Upstream** are dependencies that **finish** with the actual table. **Downstream** are dependencies that **start** with the actual table.Exclude Integrations or Exports (If needed) (Counter 14)
- Finally, schedule a run or choose to run the job immediately. (Counter 15,16)
Static Dag (Static directed acyclic graph)
Shows an Easy way to build a CI/CD pipeline of data. The orchestration is build by Importing Nodes Into the Canvas (with or without their dependencies). You immediately view the asset dependencies because they are represented as nodes.
Important note! The Static dag does not change during pipeline changes. For example if dependencies change by adding a new model, integration or export everything it is not automatically added in the CI/CD pipeline. It is up to you to update it manually.
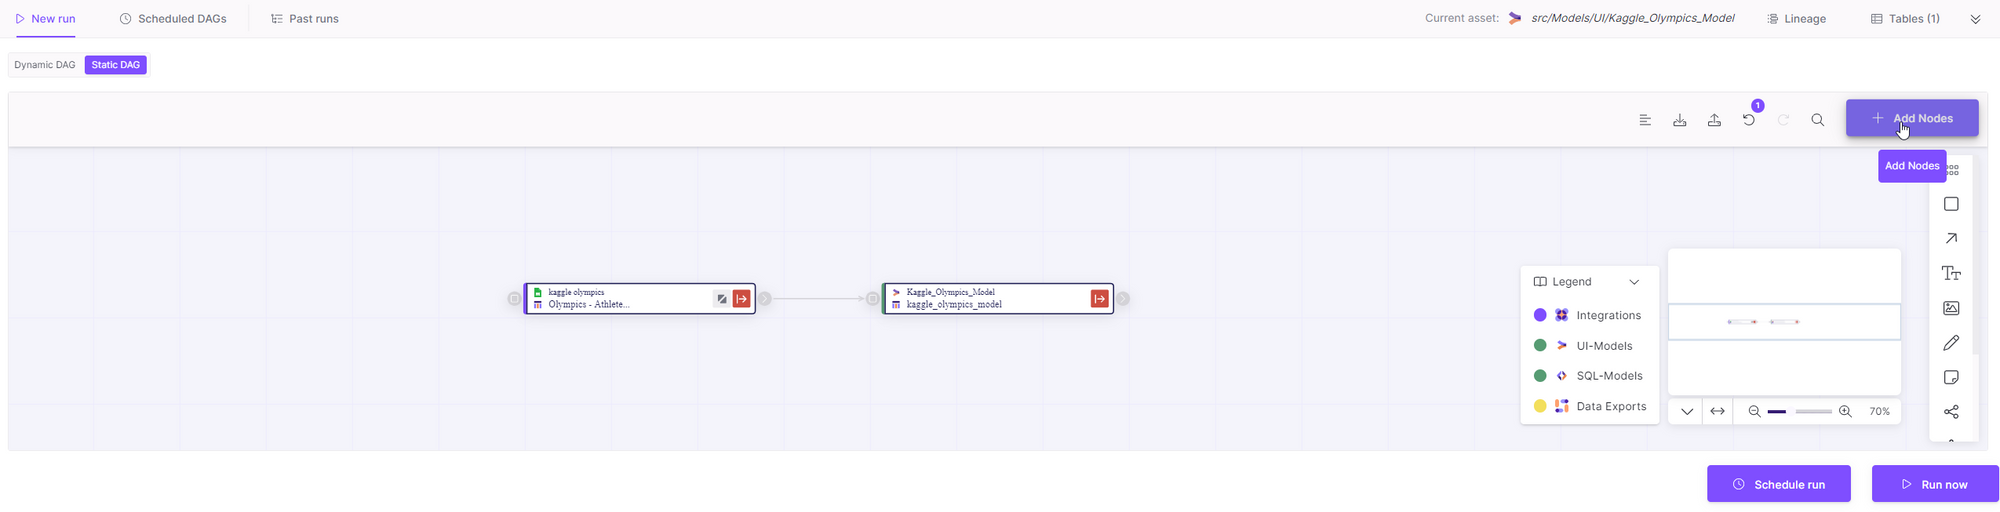
To create a Dynamic DAG:
-
First select the Nodes you want to import into the canvas, by clicking the Add Nodes button.
You can import a single node or import the asset with its dependencies (All downstream dependencies will be imported automatically). -
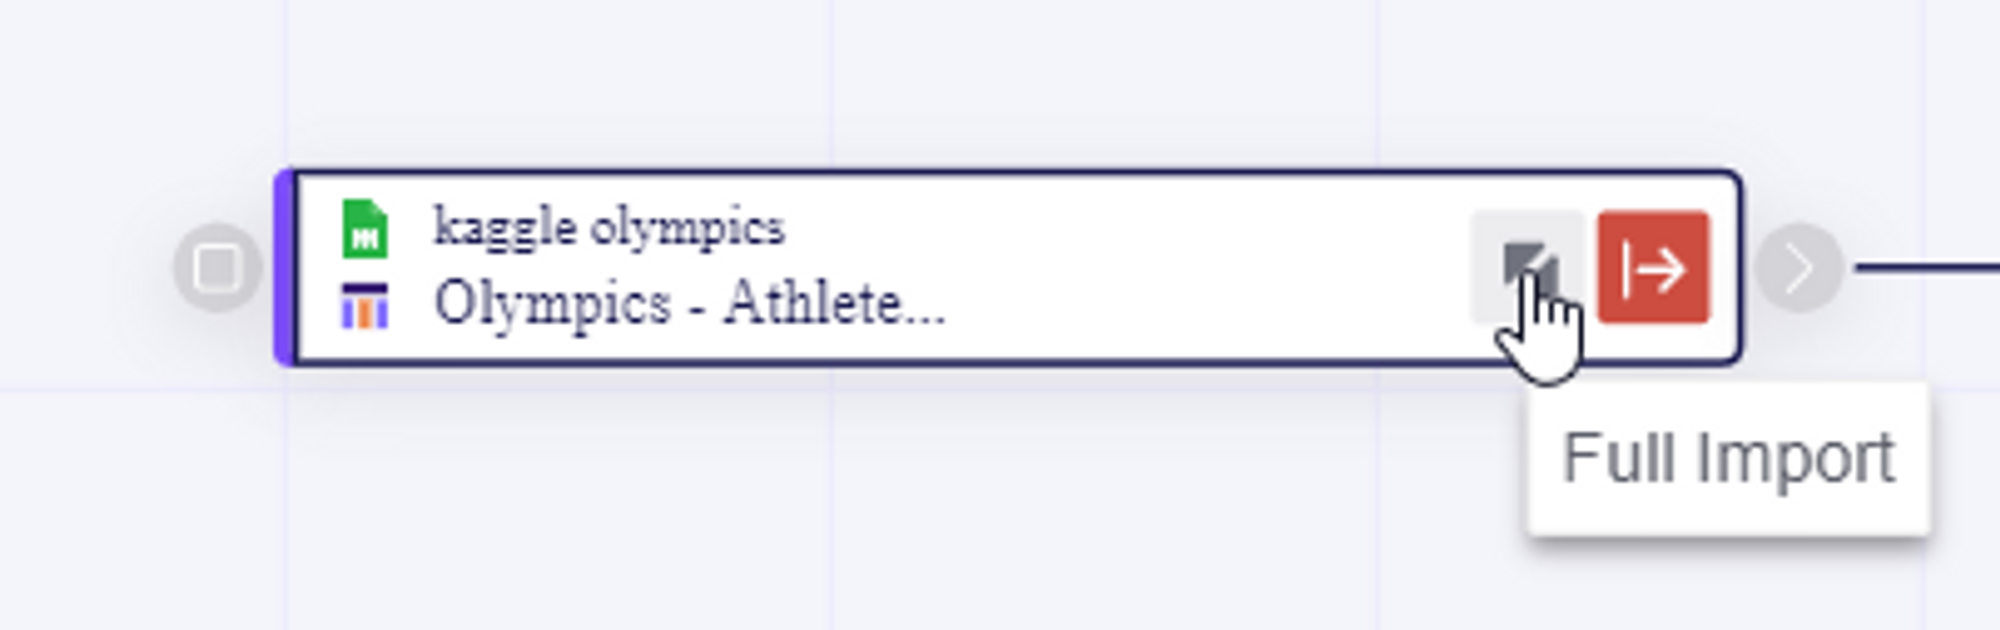
Choose your preferred mode (Incremental or Full import), by clicking the mode of the individual Node in the mode button you can choose if it should be Full or incremental
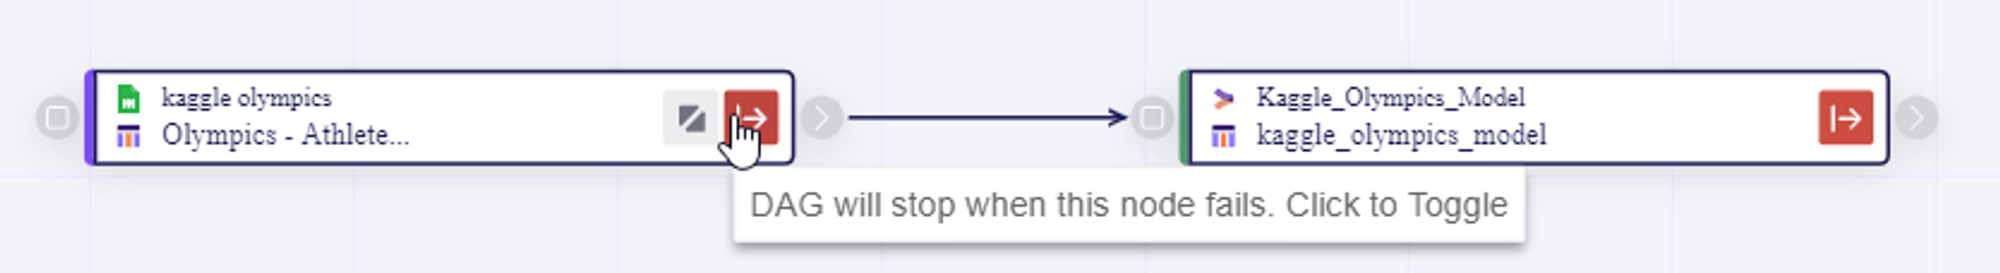
- Choose what happens if one Node job run run is unsuccessful. Should it stop or not?!
-
Next, build dependencies between these assets if needed. If you have chosen to import nodes with dependencies than there is no need to do this step. But if you have imported the nodes manually, then you might have to connect and reorder the nodes logically.
-
Finally, schedule a run or choose to run the job immediately. (Counter 15,16)
11- Select Assets
First select the asset(s) that you want to import or update.
12- Preferred mode
Here you can Choose your preferred mode (Incremental or Full import), by clicking the mode of the individual Node in the mode button you can choose if it should be Full or incremental
💡 By default the preferred mode is always the incremental one!13- Build Dependencies
When updating the pipeline you can choose which parts to update (Upstream or Downstream).
💡 **Upstream** are dependencies that **finish** with the actual table. **Downstream** are dependencies that **start** with the actual table14- Exclude Dependencies
There are scenarios where you might not need to update Integrations or Exports in your data pipeline. You can do so by checking which types of assets you want to exclude.
14- Schedule Run
After you have set up a dag, you can schedule it to run automatically according to your needs.
💡 We only allow standard cron expression!Reference: https://crontab.guru/#7_5-22_____1-5
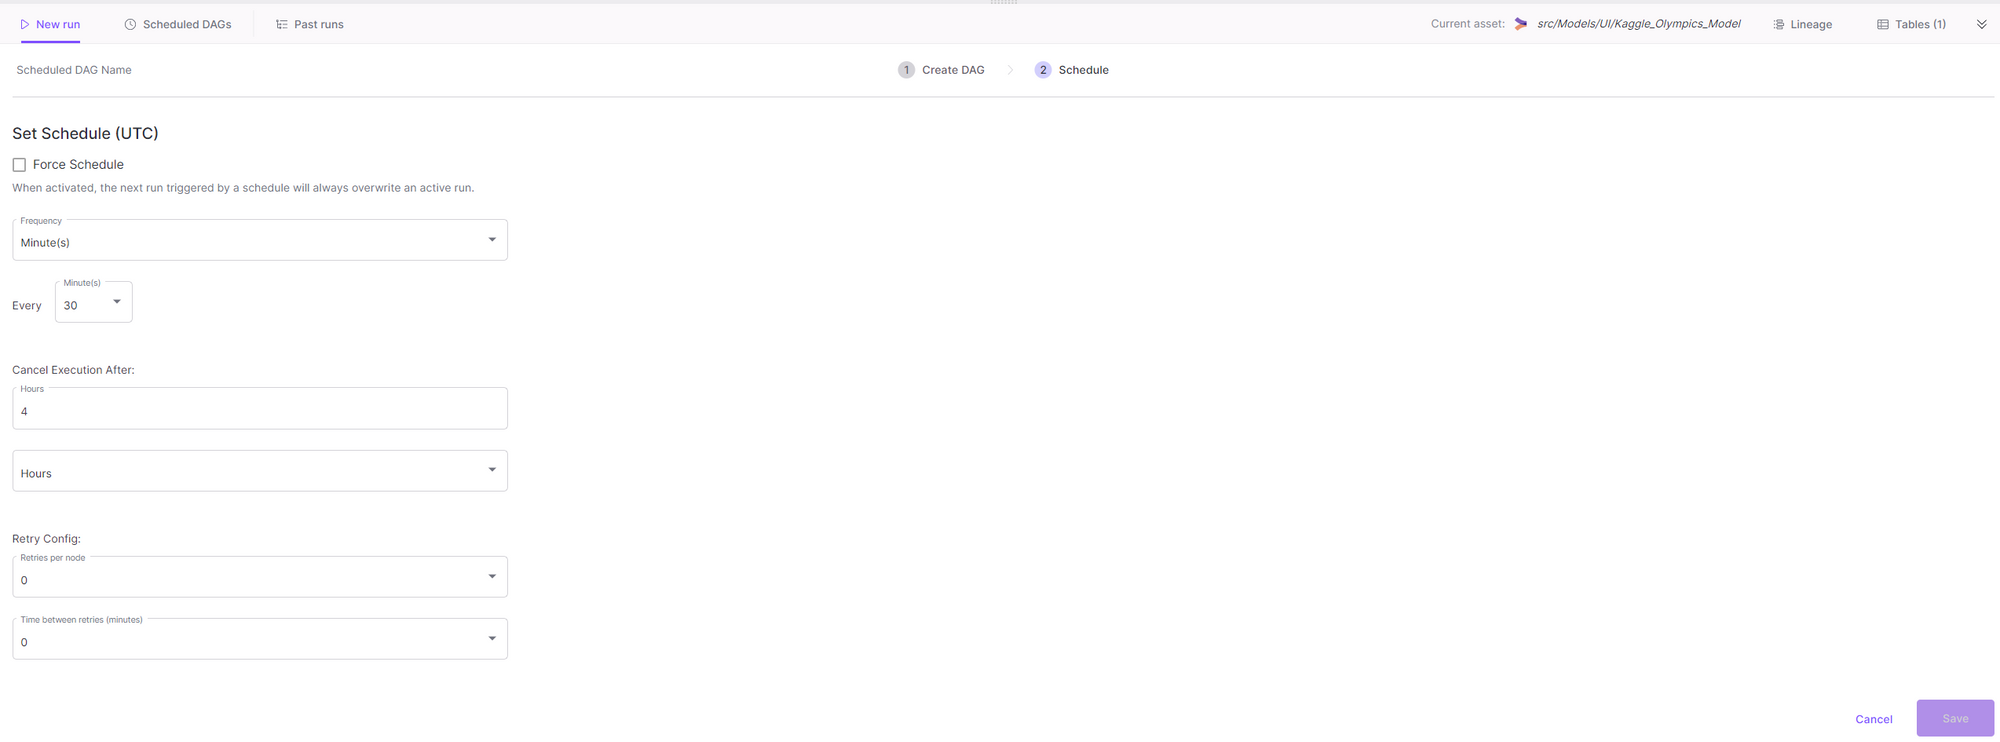
- Set Schedule.
You can set the schedule to run automatically according to your needs: In Minutes, Hourly, Daily, Weekly, Monthly and Yearly bases.
A job will be created in each run.
Cancel Run of DAG
You can cancel the execution of an orchestration it it exceeds the given time.
Retry Config DAG
Here you can set the number of retries per failing node and the time between retries.
15- Run Now
Trigger now. When you click Run now it will run the orchestration flow, by creating immediately a job that will update your CI/CD pipeline.