Once you enter to the Alerts product you get immediately introduced to the Alert Overview Menu, where all the Alerts that are created appear. There it is listed all the necessary information to immediately attest what you are going to do next.
Let's now introduce each section of the Alerts Overview Menu:
(by the counter in the image below):
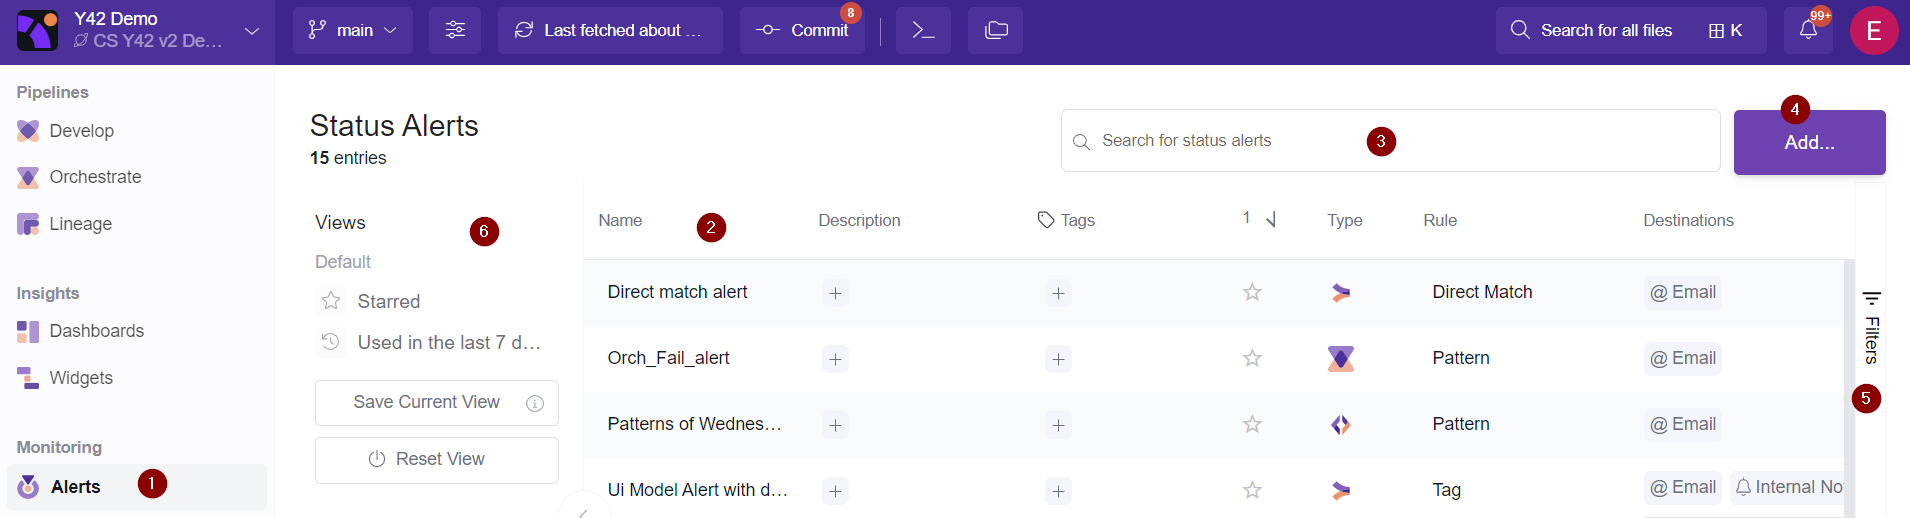
1- Alerts button.
By clicking it the Alerts Overview Menu will appear.
2- Alerts Grid.
In this data table you can find all the necessary information about each Alerts like:
- Name of the Alert.
- Description. if shows the description of the Alert. You can add a Description by clicking the edit sign in the description placeholder, or also edit it by clicking the text you want to update.
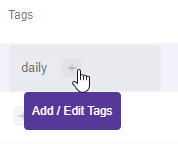
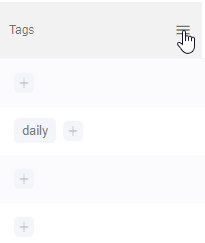
- Tags. By clicking the + sign you can easily add tags.
This can help visually find the Alerts or you might as well filter them by clicking in the tags column filter.
- Starred. You might click the star and make it yellow. This way you can filter by starred or just find it easy visually.
- Type. The Type of the Alert on which source is triggered (Integration/ Ui-Model / SQL model/ Export/ Orchestration)
- Rule. It shows the matching rule strategy you choose on the source type selected:
a) Direct. Here you select specifically the actual sources this Alert will watch for the statuses.
b) Tags. Here you select the records based on tags .
c) Patterns. Here you select the records based on a matching phrase in the title.
- Hint: Use wildcard * to match zero or more characters. Pattern is case-insensitive. Example: ***hou* would match "Red House".**
- Destinations: Shows if the notification is sent to an email and/or to the internal notification system.
- Status. It displays the selected status event to watch for the specific Alert. It can be any of: Success, Failure, Partial Success.
- Last used. Shows the time a Alert was last used.
- Last Triggered. It shows when it was its last trigger.
- Last Valid Job. Shows the time when the last valid job is executed. In other words shows the last time your Output data set is updated.
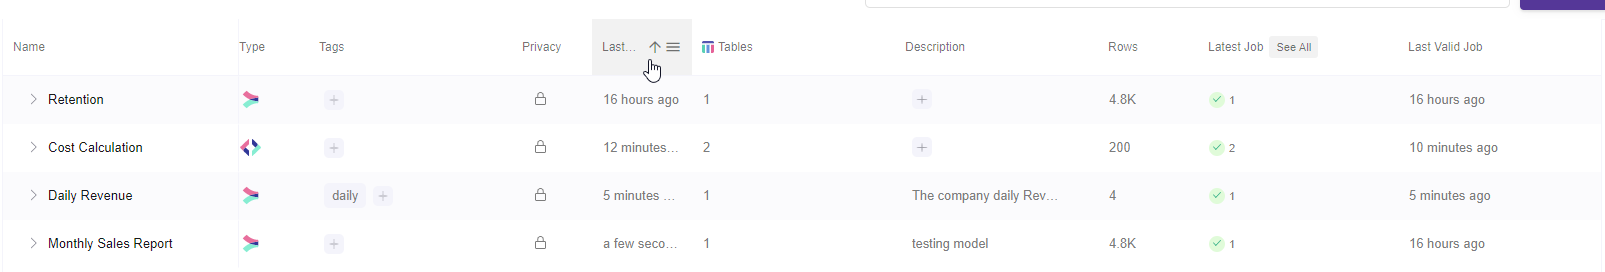
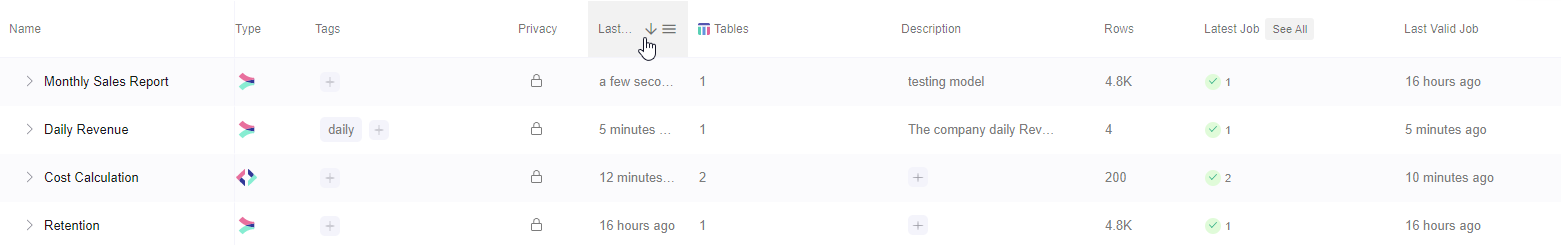
Important Note: Every column can be filtered and ordered by.
If you want to order by simply click on the header of the column until an arrow up and down appears:
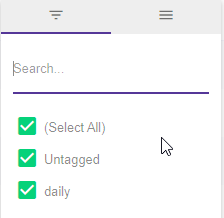
If you want to filter, then just hover to the column header and click the button that appears:
3- Search for Alerts.
Here you can search for Alerts by simply typing the name of it.
4- Add..
With this button you can add a new Alerts. Simply click it and follow the steps to create one.
5- Filters.
By clicking the filters button it opens a quick overview of the columns vertically.

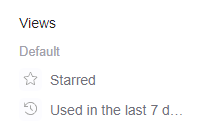
6- Views.
This is a very Handy helper so you can jump directly to some preset filters like:
But what is even more powerful is the fact that you might create your personalized views, by simply following these steps:
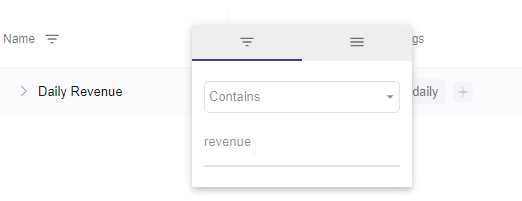
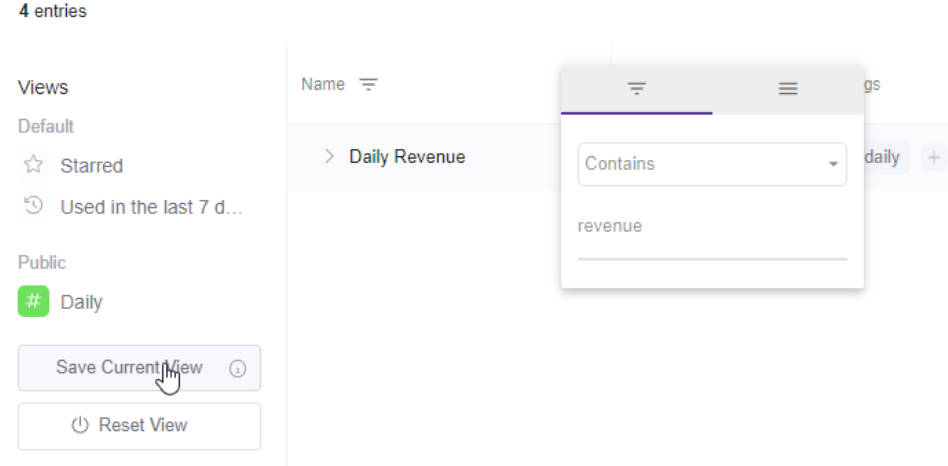
I.- Filter or Order by any column.
Here for example I will filter with the name revenue:
II. - Click "Save Current View" button.
III. - Add the View a descriptive name and/or icon &color and click Save.
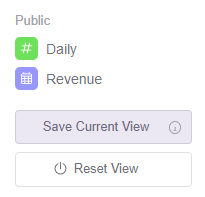
IV- If you want to jump back to the default view of all the Alerts, simply click the "Reset View" button.