The Pivot Node allow you to create a Pivot Table on your data in order to summarise, sort, reorganise, group, count, or average data stored in a table. It allows you to transform columns into rows and rows into columns. In other words, by pivoting your table you will rotate a table-valued expression by turning the unique values from one column into multiple columns in the output.
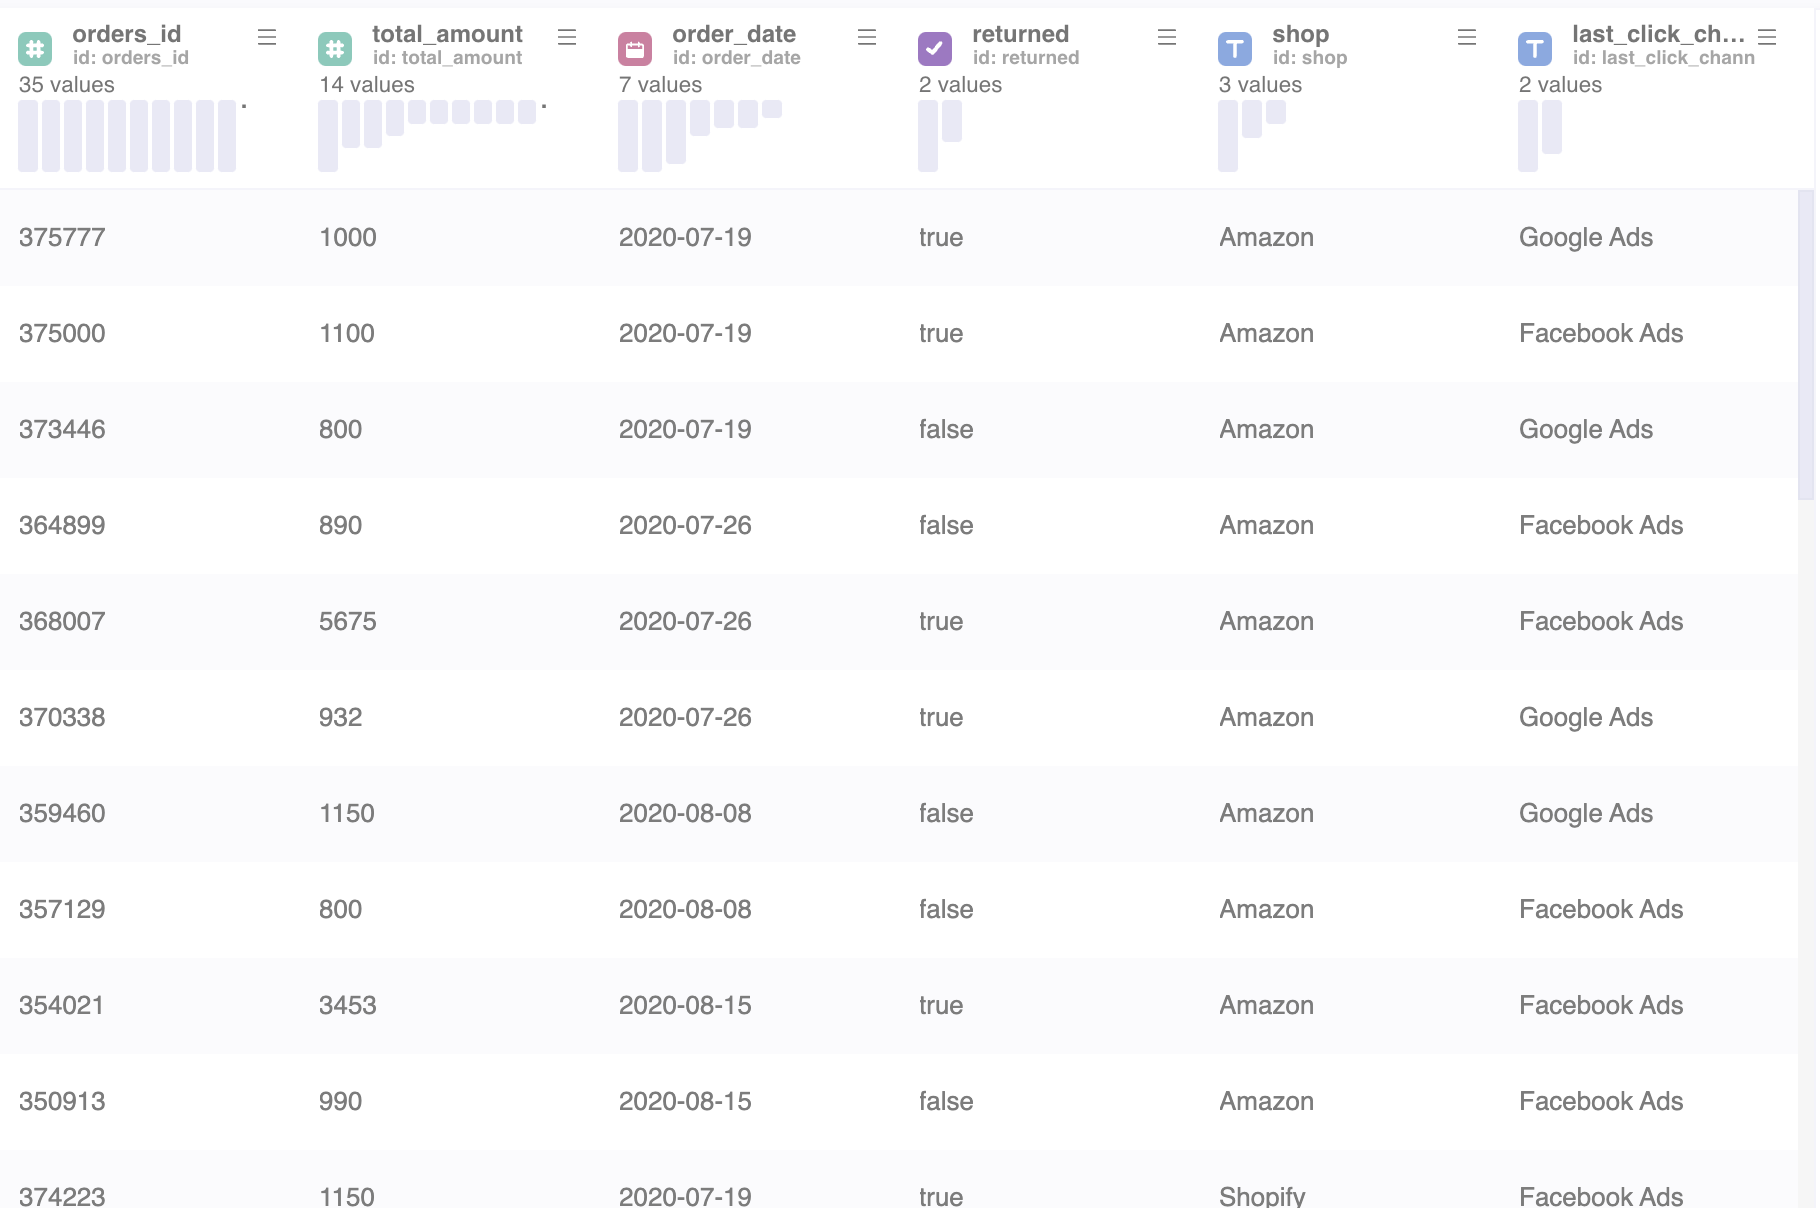
For instance, you can use the Pivot node on a table that looks like this and restructure its data and granularity:
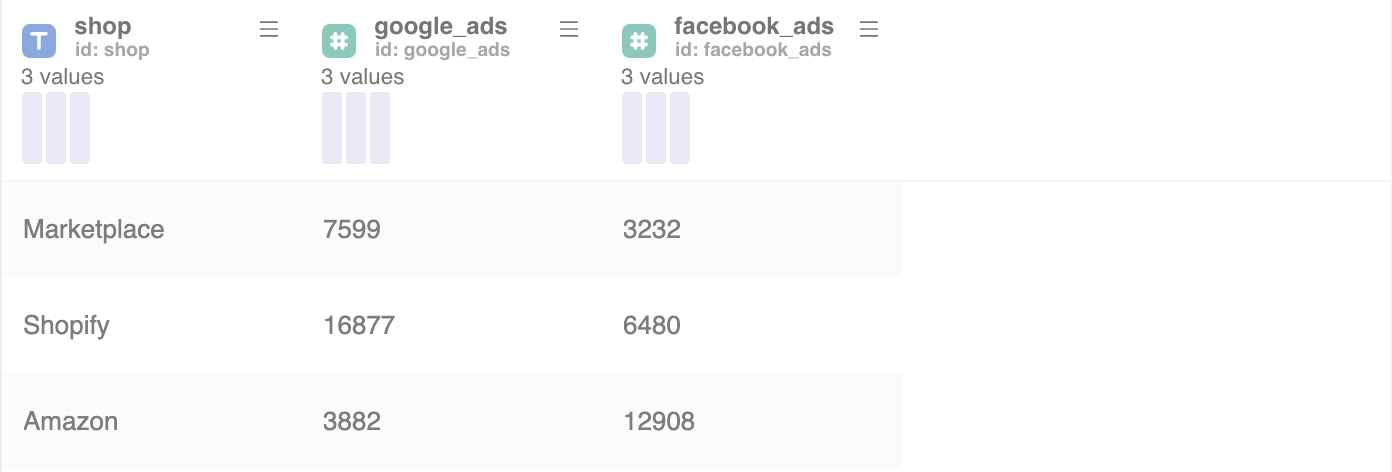
Now we get at a table that looks like the following, in which the unique values for last_click_channels become their own columns summarizing data, a specific metric (total_amount), broken down by the different shops:
Note: In order to use the Model feature you already should have already imported data sources into Y42.
Setting up your Pivot Node
- Click on the Pivot Node to apply the settings.
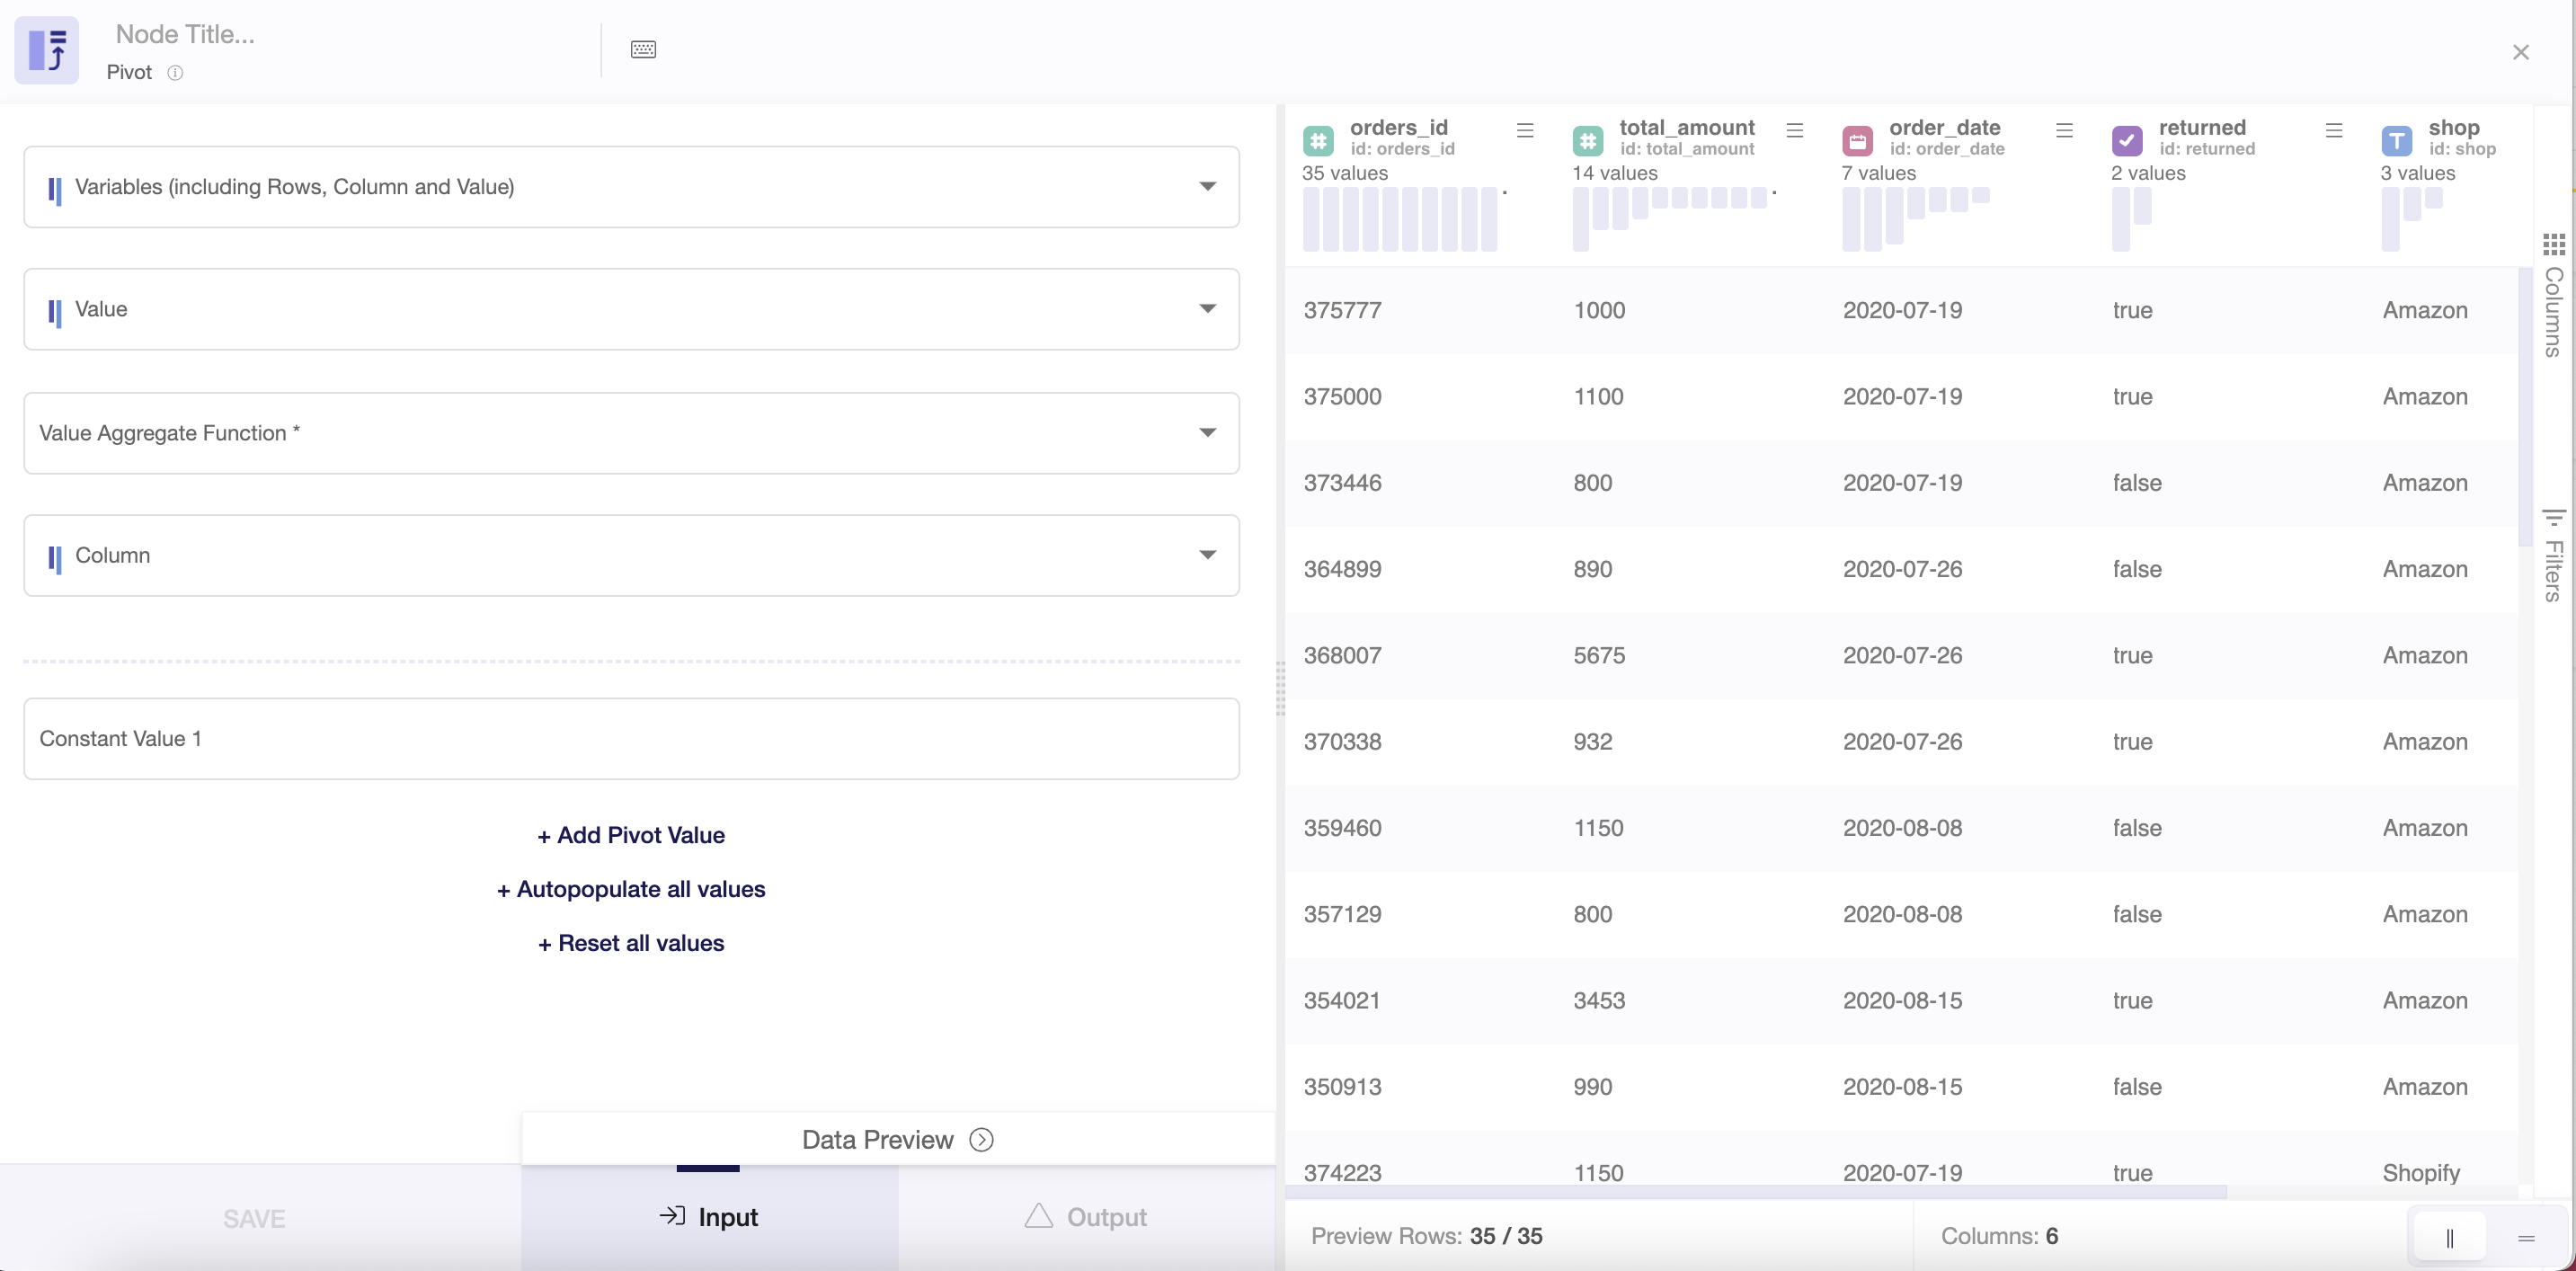
- Continue by selecting variables. These are the columns with values you'd still like to see in your pivoted table - either as aggregated metrics, values from rows to be rotated into columns, or kept as rows to break down your data with additional dimensions.
- Select the Value. This the column in which the values will be applied the Aggregate Function and grouped by the constant values from the field selected for the Column field.
- Select your Aggregate Function. This is the function (SUM, AVG, COUNT, MIN, MAX) which will be applied on the Value field when aggregating the data by the constant values.
- Select your Column. In other words, the column in which the unique values from its rows can be transformed into their own columns. These unique values will be the Constant Values.
- You can easily select all unique values from the Column field to become their own columns by clicking on + Autopopulate all values or remove this selection by clicking on + Reset all values.
- Click on Output to preview the changes, and if satisfied click on Save to finish it up.
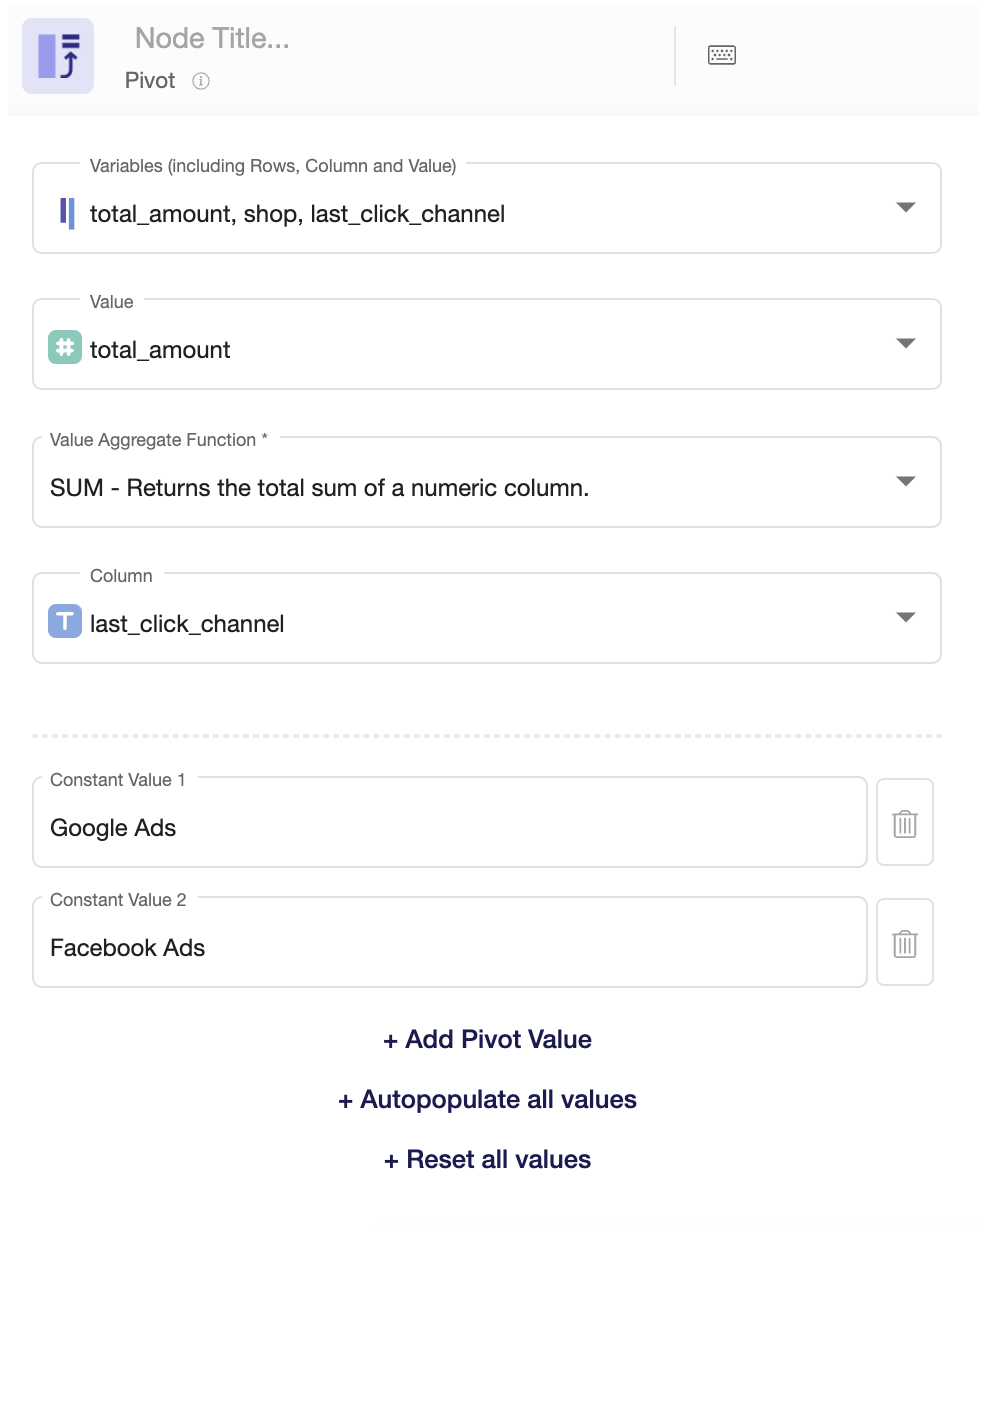
To illustrate better these node settings, take the following setup as an example - used to achieve the use case in the beginning of this article:
Once you're done with this transformation, you can either perform further transformations or, if you want to export the new data table, click Commit Model.