Once you enter the UI Models, you are redirected to the Model Overview Menu, where all the created models are listed, as well as all the necessary information to immediately attest to what you are going to do next.
Once you enter a particular model, by default you are entering the Jobs tab. Let's now introduce this section by all its elements:
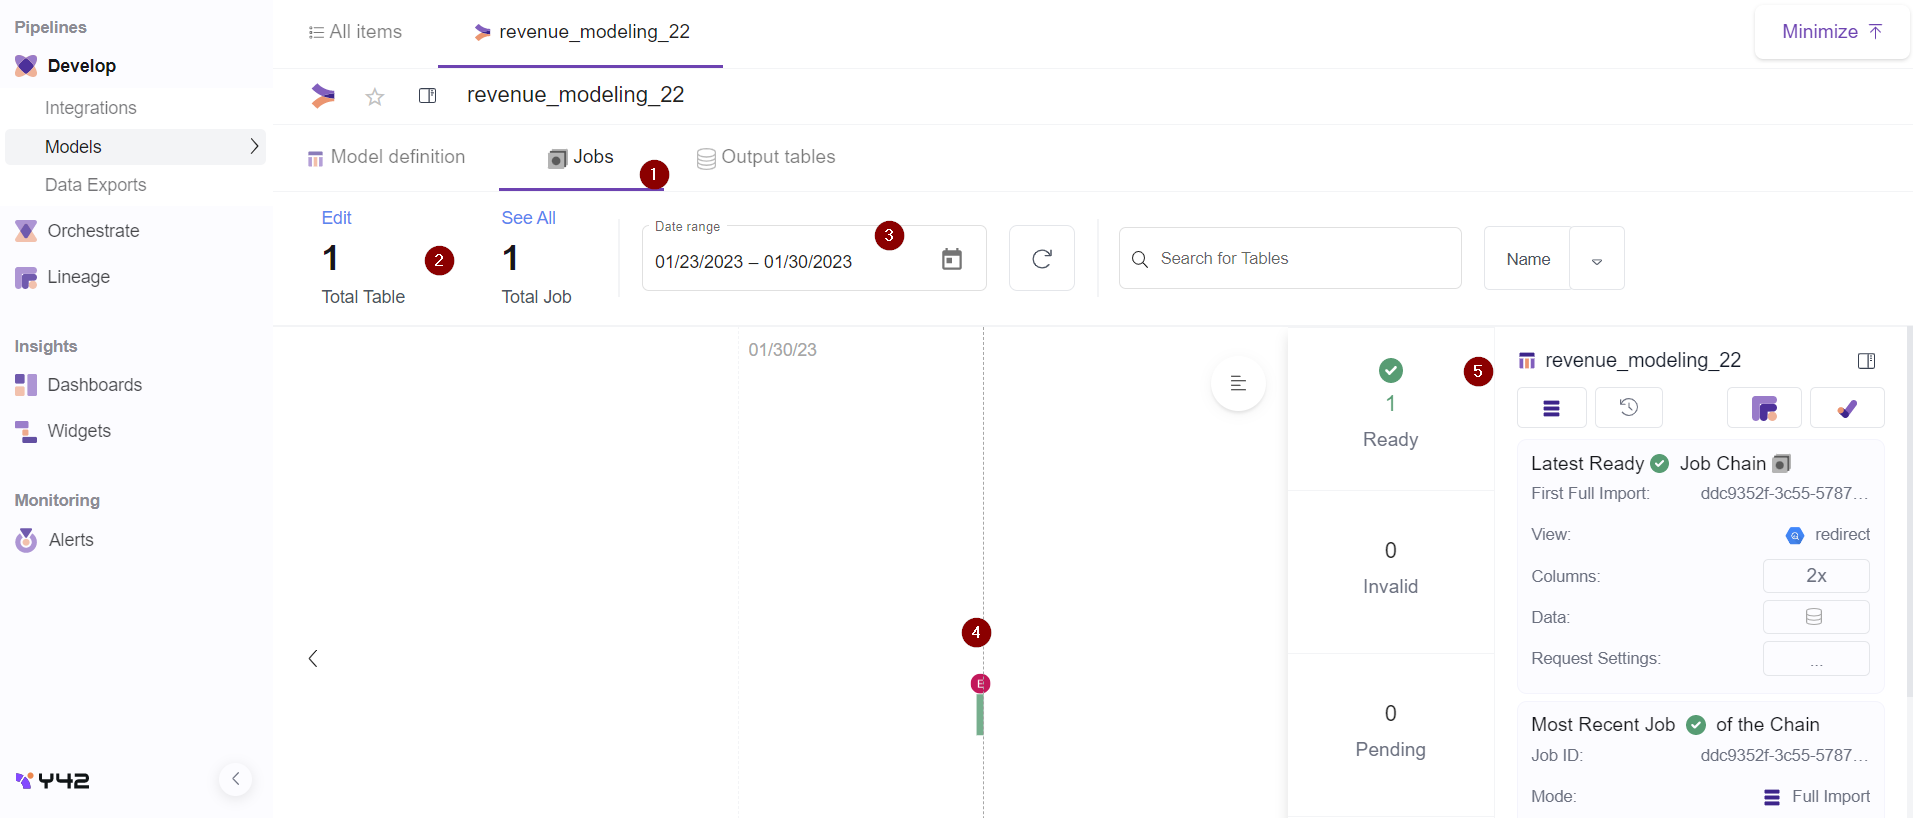
1 - Overview button. By default once you enter to a model you will go strait into the Overview section.
2 - Total Tables and Total jobs counter. It displays to total number of tables (Outputs) and Total Number of Jobs (for all the tables).
3 - Range of Date. In this setting you can control the date range of the jobs that appear in the overview section for each table. By default it is 10 days, but you might easily change the range by changing the dates.
4- Single Job. The pin marks show the time when each job run. Here you will notice the status of each job (Ready, Failed, Pending). In this pin mark you get immediately this information:
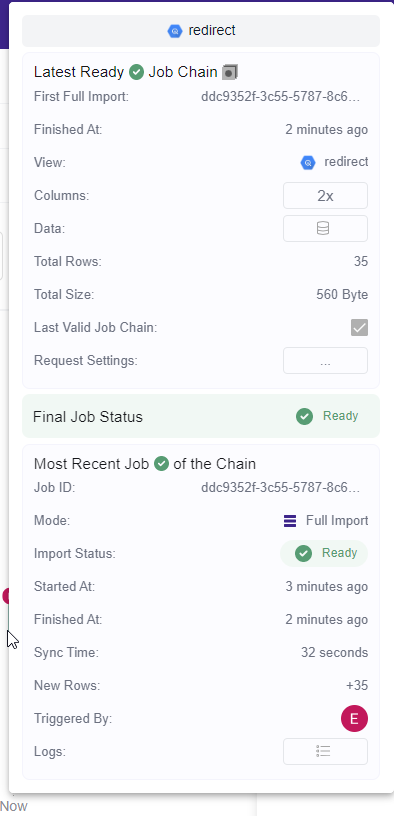
- By hovering on the letter (user initial) on top you get to know immediately which user triggered this Job, or if it was the orchestration that did it automatically.
- By clicking on the vertical line of the pin, the window above opens detailed information on the single job - for example, job Id, status etc. You can additionally do the following:
- Accessing the data in BigQuery
- Open the Logs
- Remove the Job
- View Job History in GIT
5 - Table Information. This section gives all the important information about the table itself.

This includes the following information:
- Table name
- Number of Successful, Invalid, and Pending jobs for a table
- Job ID, Status, Total Rows, Total Size, Started At, Finished At, Sync Time, Avg Sync Time
You may also do the following actions:
- Rename or delete the table:

- Accessing the table directly in BigQuery:

- Manually trigger a full import of the table:

- View file history in GIT:

- View the Dependencies relations of this table with other modules. A tree-like popup window will open by showing graphically the dependencies:


- View table logs:
