What is UI Modeling?
The UI-Model is a drag-&-drop interface for data modeling which enables any user to turn raw data into clean datasets for data analysis & reports. With drag-&-drop nodes users can build data modeling workflows without the need to write a single line of code.
The UI-Model allows users to easily connect multiple data tables into one and transform such data. If you have complex and big data coming from different sources (i.e. Excel, Google Sheets, Facebook Ads, Shopify, HubSpot, etc.), Y42 allows you to combine and transform these data sources.
Note: In order to use the Model feature you should have already imported data sources into Y42.
Learn more on how to create your first UI-Model.
UI-Model Menu Overview
Once you enter the UI Models, you are redirected to the Model Overview Menu, where all the created models are listed, as well as all the necessary information to immediately attest to what you are going to do next.
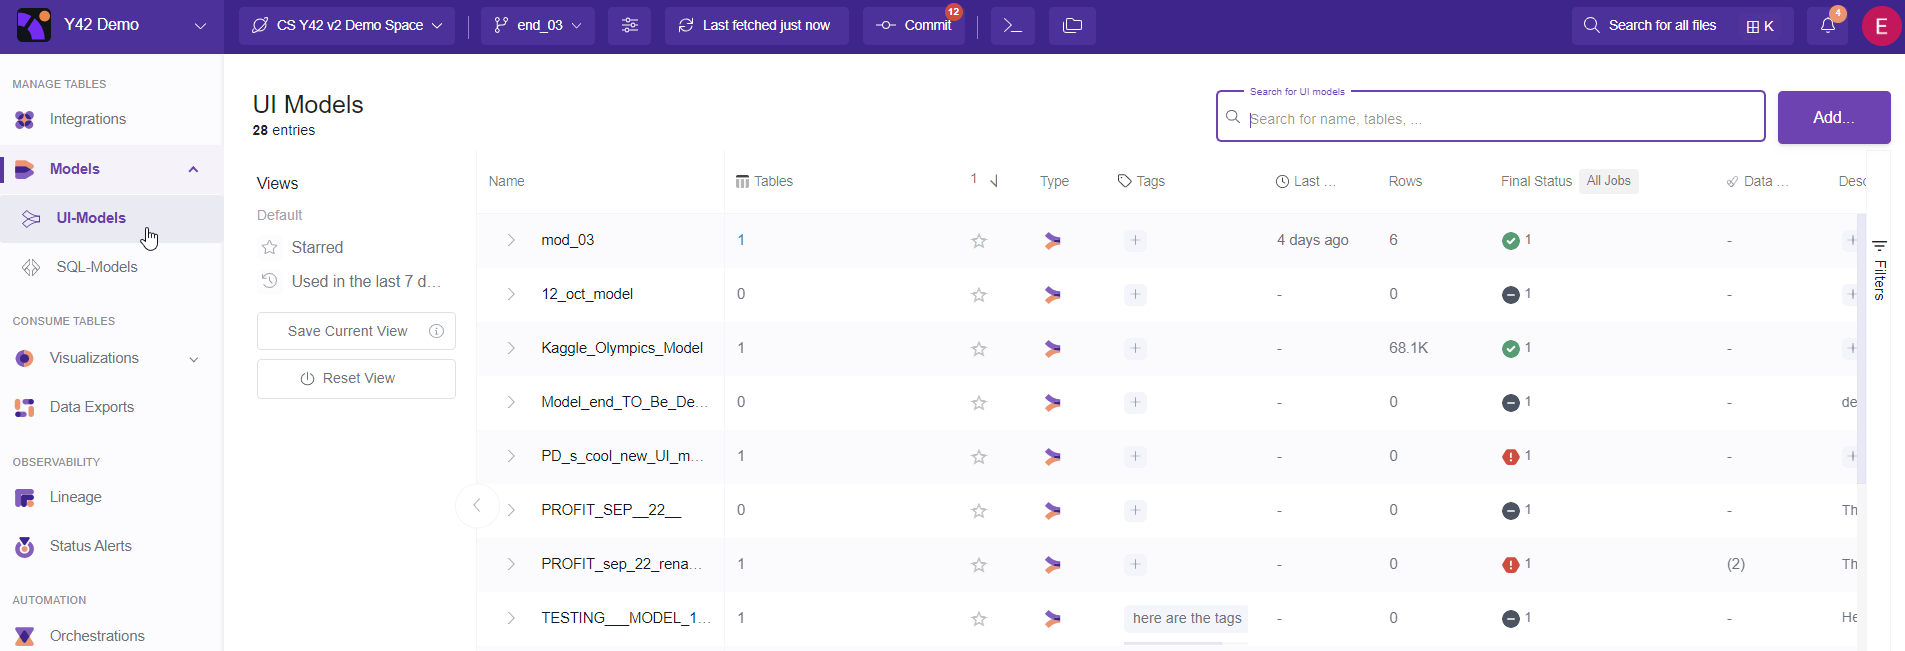
Learn more on Model Overview Menu by reading [this article](https://Model Overview Menu).
UI Model: Table Set-Up
Once you enter a particular model, by default you are entering the Overview tab. To create a new model or change an already existing one, jump to Table Set-Up **** tab. Since you are in this section, you probably already have knowledge of how to create a new model.
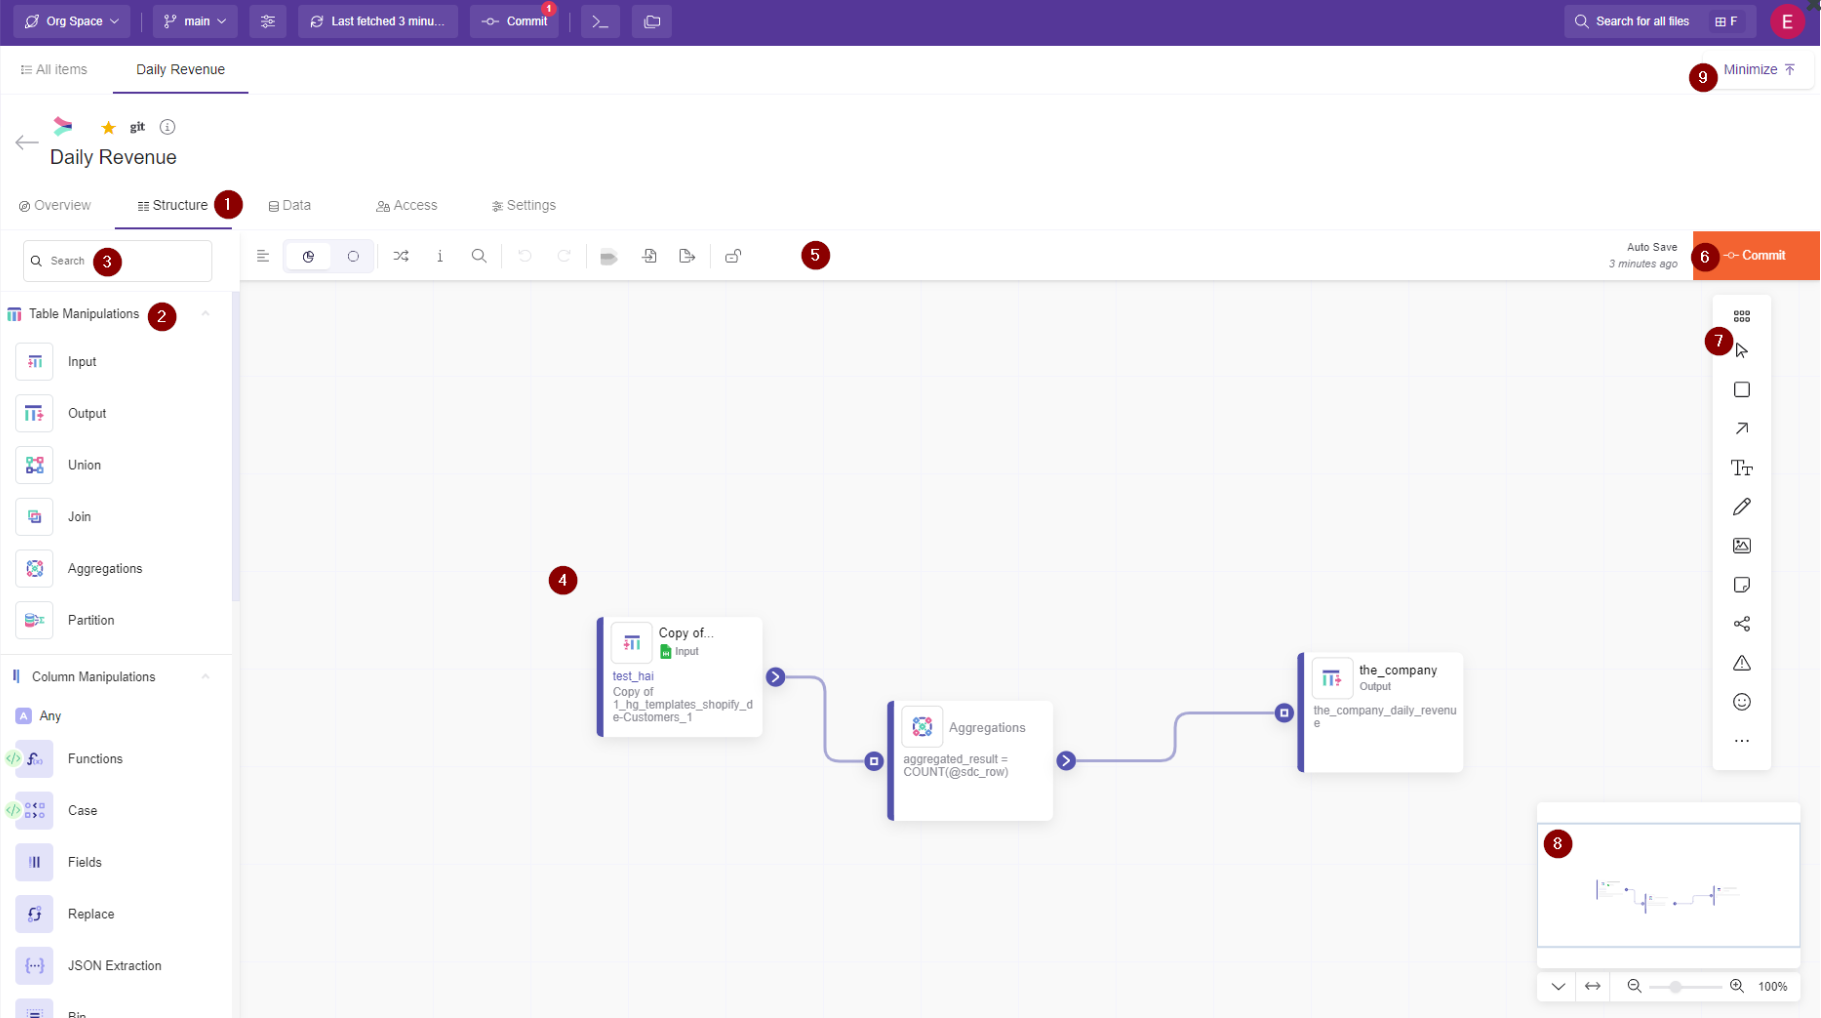
In the table set up tab, all the data transformation will happen.
You can use all the nodes you need to create your special report:
The Nodes are grouped into these categories:
Table Manipulations
Input
Output
Union
Join
Aggregations
Partition
Column Manipulations
Functions
Case
Fields
Replace
JSON Extraction
Bin
Transpose
Coalesce
UniPivot
Pivot
Fill
Date Time
Date Comparison
Date Parser
Date Formatter
Date Manipulation
Geo
Geolocation
String
Text Extraction
Row Manipulation
Advanced Filter
Filter
Sort
Remove Duplicates
To create a complete model you will need to add at least, one Input, one transformation model and one output.
The input node lets you add your raw data which are already imported to y42 into the canvas.
Transformation nodes are all the nodes except from the input node.
We need add to the output node because it creates a new table, which you can use for building a pipeline with Orchestration, using it for another model, using it for exports or using it for visualizations.
You need to **Commit & trigger table jobs ** to create the model table. You can create as many outputs as you would like for each transformation path.
Learn more about the table set up tab in this article.
UI Model: Data Tab
After you have set up a structure, meaning that we now have an output table from our model and Commit & trigger table jobs, you can view the result of the output table in the **** Data tab.
Lear more on data tab and its elements in this article.
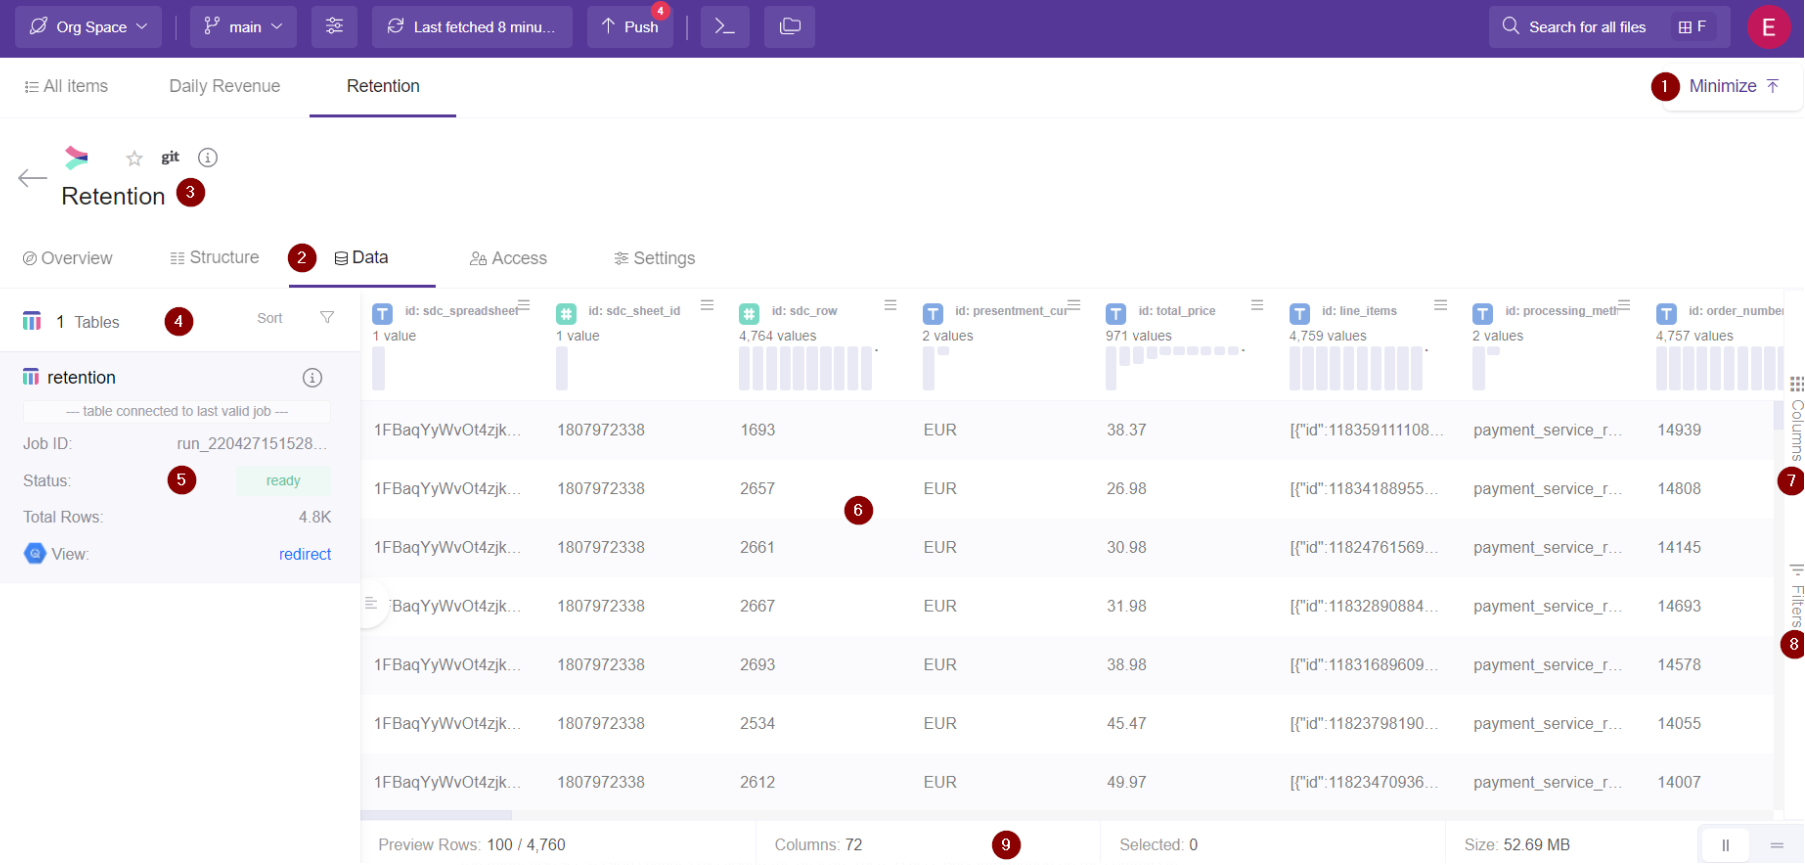
Here it will appear the tables of your output nodes, showing their last successful job data.
Your table now is accessible by Orchestrations, other UI models, SQL Models, Exports, Alerts, Data tests , Visualizations.