Once you enter to the SQL Models product you get immediately introduced to the SQL Model Overview Menu, where all the SQL models that are created appear. There it is listed all the necessary information to immediately attest what you are going to do next.
Once you enter to a single model, by default you are going to enter to the Overview section.
Let's now introduce this section by all its elements:
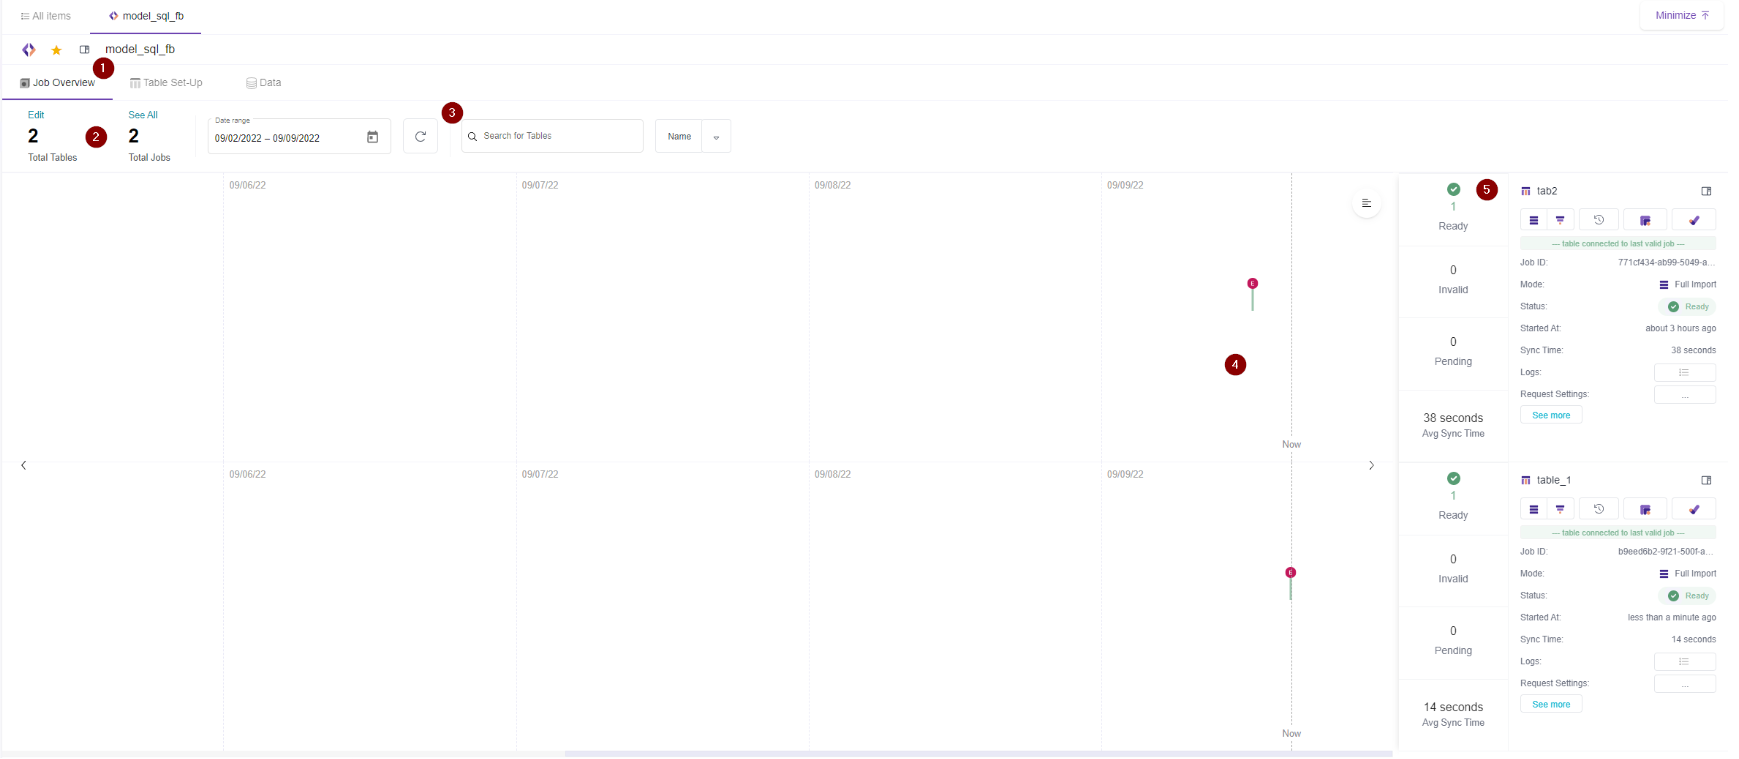
1- Job Overview button.
By default once you enter to a model you will go strait into the Job Overview section.
2- Total Tables and Total jobs counter.
It displays to total number of tables (Outputs) and Total Number of Jobs (for all the tables).
3- Filtering and Sorting.
You can filter Jobs and Tables by:
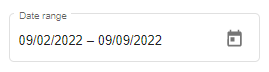
- Date Range.
In this setting you can control the date range of the jobs that appear in the overview section for each table. By default it is 10 days, but you might easily change the range by changing the dates.
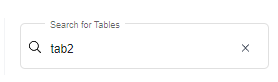
- Search for Tables.
Search specific table inside the Model.
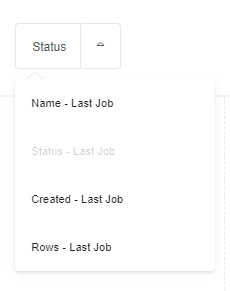
- Sort jobs by: Name, Status, Created, Number of rows.
4- Single Job.
This pin marks show the time when each job run. Here you will notice the status of each job (Ready, Failed, Pending).
In this pin mark you get immediately these information:
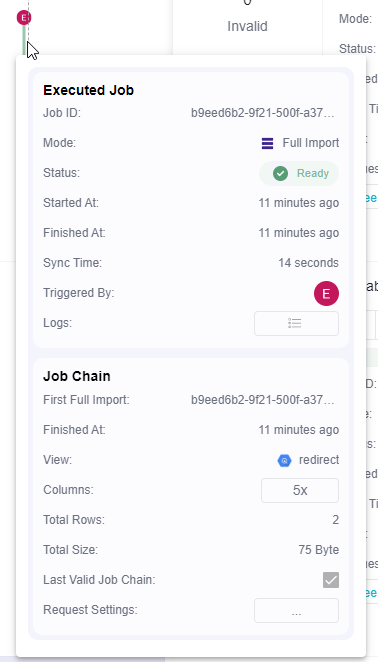
- By hovering on the letter (user initial) on top you get to know immediately which user triggered this Job, or if it was the orchestration that did it automatically.
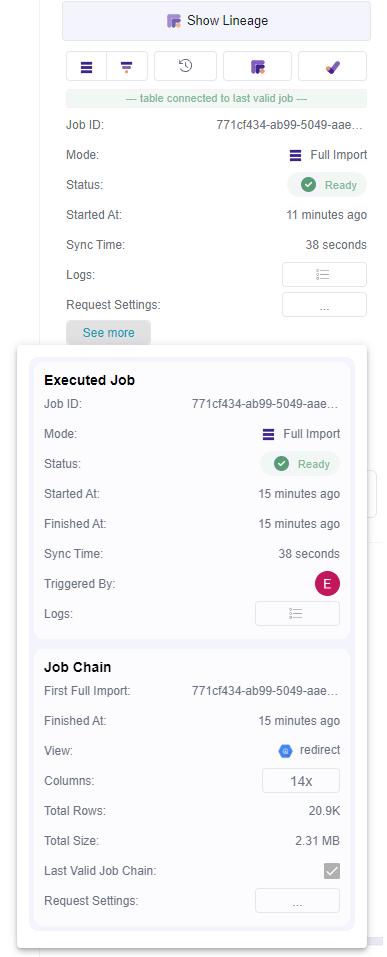
- By clicking on the vertical line of the pin, the window above opens giving detailed information on the single job, like for example job Id, status, started at, finished at, total size, sync time. You can additionally do actions like:
Open the Logs
View Job request Difference
5- Table Information.
This section gives all the important information about the table itself.
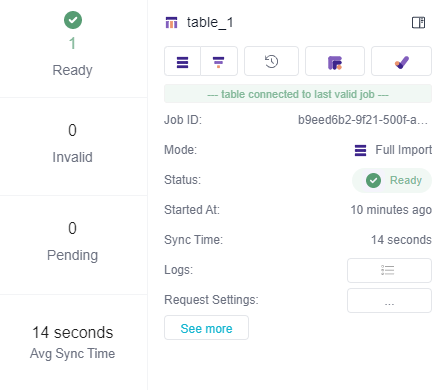
You can directly get information like:
I. Table name
II. Number of Successful, Invalid and Pending jobs for table.
III. Job ID, Status, Total Rows, Total Size, Started At, Finished At, Sync Time
Each table will display the following information and actions:
- Table name
- Job Id
- Status. (Ready/Pending/Failed)
- Click the 'See more' Button
- Total rows. The total number of rows this single table has. (Note: The number showed is rounded.) (Once you click the 'See more' button )
- Redirect to BigQuery. Once you click the link you will be brought to the BigQuery table. (Once you click the 'See more' button )
- Open Logs (Once you click the 'See more' button )
- Open asset.
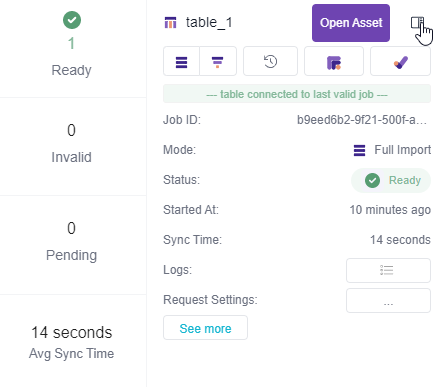
For each table you have the possibility to :
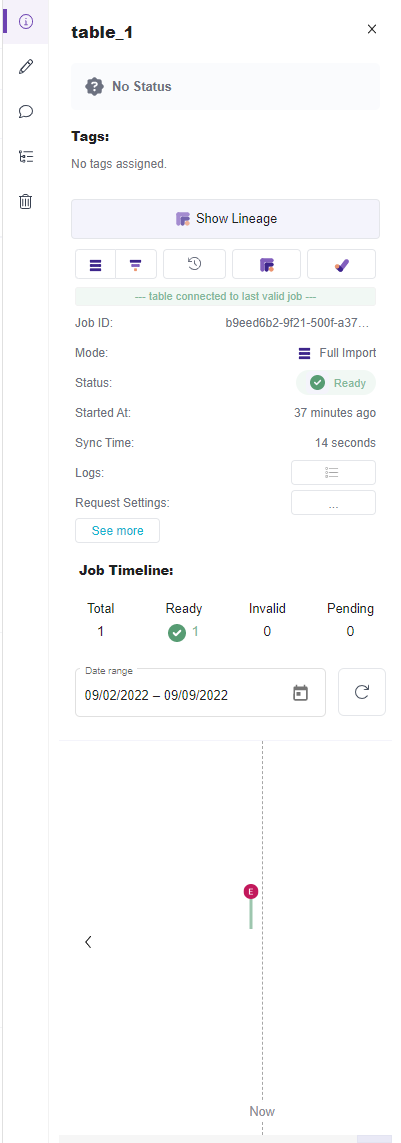
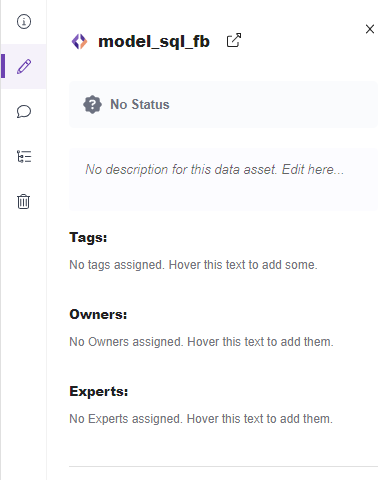
a- View information about the table:
View the metadata like Tags, Owners, Experts, or View logs, request settings, job statuses and timeline.
By clicking the 'See More' button you can view all the condensed information in a popup:
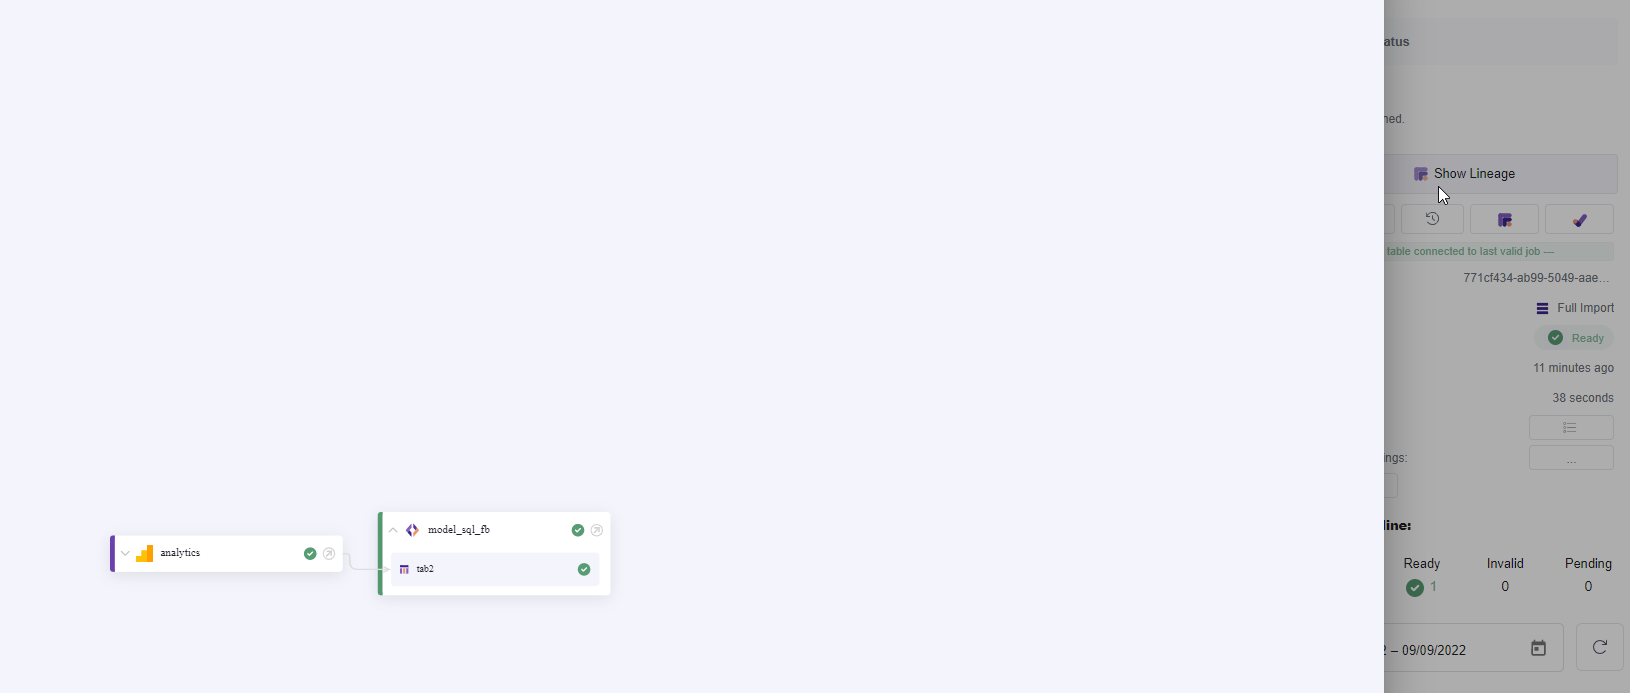
b- Show Lineage:
By clicking the "Show Lineage" button you can view the dependencies relation of the table in a tree like form.
c- Trigger a Full or Incremental Job for the table
d- View History
e- Add data tests on this table
f- Edit the metadata like Tags, Owners, Experts, or View metadata file history:
You might also see version changes by clicking the Metadata File history.
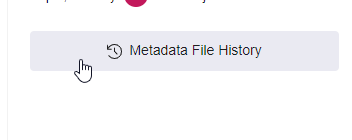
Here it is provided all the necessary information on the commits in history, changes, who changed it, what is changed.
e- Add comments
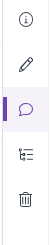
g- View upstream and downstream dependencies.
It shows the dependency logic before the actual table (Integrations or other model dependencies) and after the actual table (Other models, Orchestrations etc)
h- Delete table.
Deletes the actual table.